LinkedIn Outreach Benchmarks 2026: Acceptance, Reply, and Message Response Rates from 13.2M Outreach Attempts
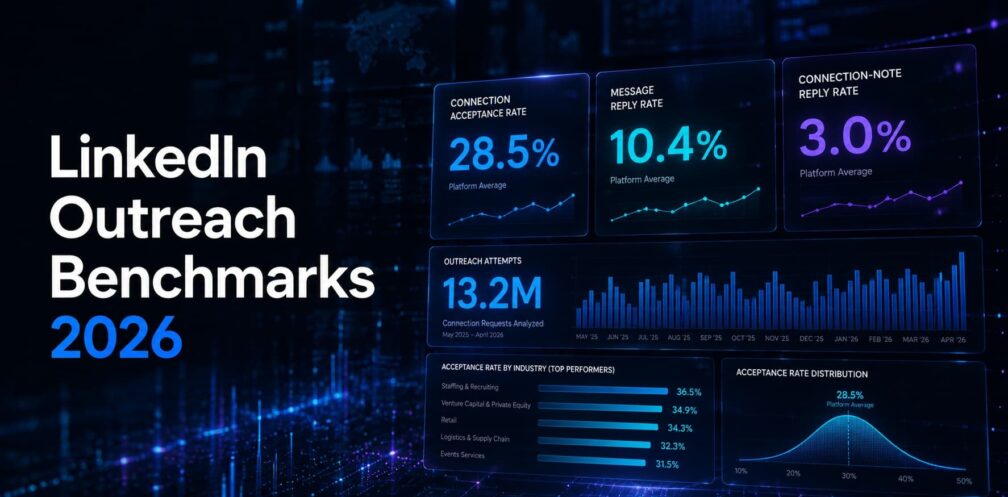
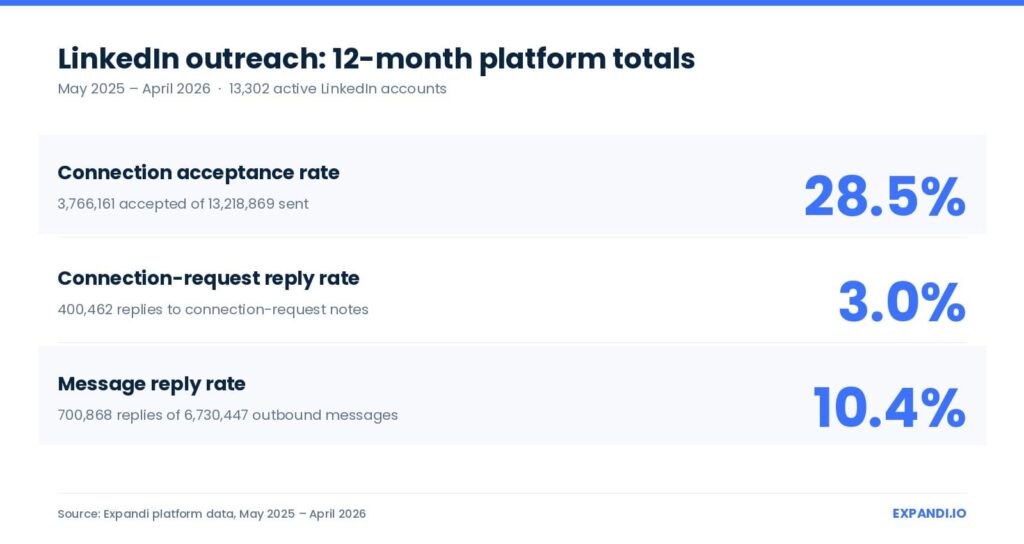
Expandi analyzed 13,218,869 connection requests, 6,730,447 outbound messages, and 3,766,161 accepted connections sent through 13,302 active LinkedIn accounts between May 2025 and April 2026.
The platform-wide averages: 28.5% connection acceptance, 3.0% connection-note reply, 10.4% message reply.
But the platform average is the least useful number in this report. Every segment breakdown that follows shows wide variation behind it: Staffing & Recruiting hits 36.5% acceptance while Apparel & Fashion sits at 19.9%.
The cost of benchmarking against the wrong number is concrete: quotas get set against averages that don’t apply, campaigns get cut for “underperforming the benchmark” when they’re actually beating their segment, and coaching aims at the wrong variable while the data points to something else.
This is one of the largest publicly available LinkedIn outreach benchmarks from a single platform, with every metric broken down by sender industry, seniority, and company size.
What the platform-wide numbers say based on 13.2 million connection requests
Across all 13,302 active accounts on Expandi between May 2025 and April 2026, the platform-wide averages were:
These three rates are independent. Each has its own numerator and denominator, with no shared events.
Connection acceptance measures whether the request itself was accepted. Connection-request reply rate measures whether the connection note received a reply, separate from acceptance. Message reply rate measures whether outbound messages (including welcome messages, follow-ups, group messages, event messages, InMails, and emails) received replies.
For comparison:
- Cleverly cites 30–45% acceptance as the “healthy” range in its 2026 benchmark
- Belkins reported 26.4% in its 2025 study, a co-authored analysis across multiple platforms that included Expandi data
Expandi’s own research put the figure at 29.6% across 70,000+ campaigns. The 28.5% in this 12-month dataset sits within that 26–32% range, on a much larger sample.
But the platform average is the least useful number in this report. Every cohort breakdown that follows shows wide variation behind it.
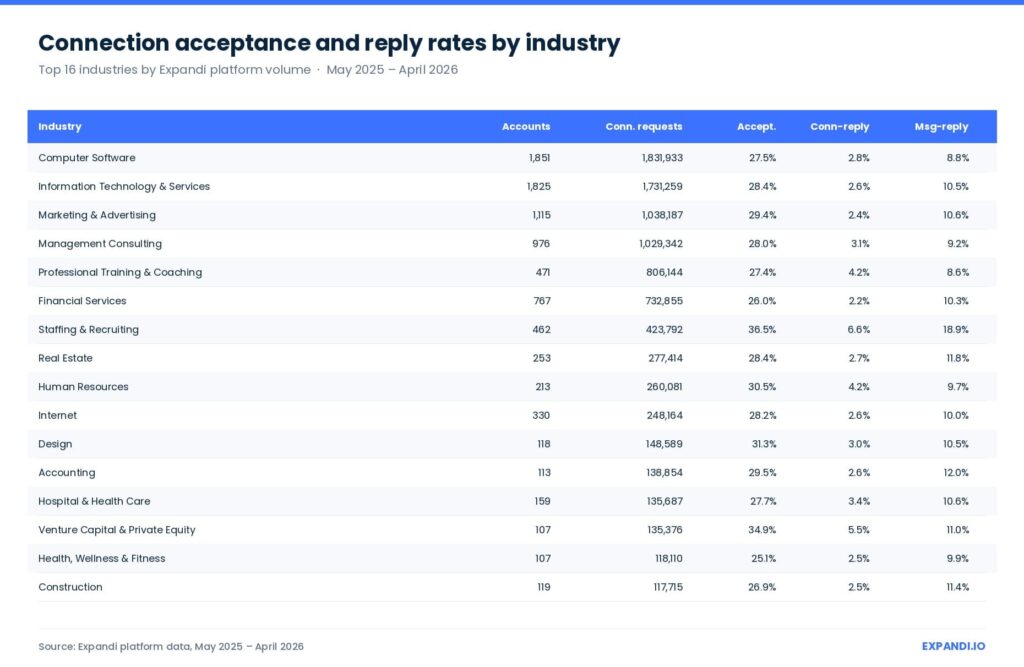
Connection acceptance and reply rates by industry
TL;DR
Staffing & Recruiting leads at 36.5% acceptance.
Computer Software, the largest cohort on the platform, sits at 27.5%.
The full spread across 60+ industries with meaningful volume runs from 17.5% (Consumer Electronics) to 40.1% (Broadcast Media).
The top industries by volume, with all three rates:
Find the full 60+ industry breakdown in the appendix at the bottom of this page.
A few findings worth pulling out.
Staffing & Recruiting hits roughly 2x platform average on every metric. 36.5% acceptance, 6.6% connection-request reply, 18.9% message reply. This corroborates what Cleverly found on a separate dataset — Recruiting & Staffing leading all verticals at 18–25% reply rate. Two independent studies point at the same pattern: when the platform’s purpose and the use case align, the numbers move.
Computer Software is the biggest cohort and the worst converter among high-volume cohorts. Software accounts for 14% of all platform volume but lands in the lower half on both reply metrics: 2.8% connection-reply, 8.8% message-reply. The Belkins/Expandi 2025 study reported 4.77% reply rates for SaaS, the lowest of any vertical they measured. Two independent datasets show the same pattern. The cause isn’t isolable from sender-side data — plausible drivers include outreach saturation among software buyers, harder relevance screening from technical audiences, ICP-fit averaging down across the segment, or some combination. What the data does establish: acceptance rates in Software look fine on paper but hide a reply problem behind them.
VC & PE punches above its volume. 34.9% acceptance, 5.5% connection-reply, 11.0% message-reply. Investors connect at well above-average rates and respond at above-average rates. Worth noting if your ICP includes them.
Apparel & Fashion, Telecom, Facilities Services, and Media Production sit below platform average across the board. Apparel & Fashion (19.9% acceptance, 1.5% conn-reply, 7.1% msg-reply), Telecommunications (21.8%, 1.8%, 11.2%), Facilities Services (23.2%, 2.1%, 9.6%), Media Production (23.4%, 1.9%, 7.2%). These are sender industries, meaning when senders from these sectors run outreach, they hit lower numbers across all three metrics. The cause is harder to isolate from the data alone — it could be ICP-fit issues, profile signal, or audience overlap with low-response recipient segments.
Two industries look like outliers but lack the sample size to confirm it. Civil Engineering shows 39.9% acceptance and 25.5% message-reply across just 13 accounts. Broadcast Media shows 40.1% acceptance across 14 accounts. Both look like top performers, but the numbers are driven by a handful of high-volume users. Treat as directional, not definitive.
The practical takeaway
Benchmark against your industry row, not the 28.5% platform average. A Software company at 27% acceptance is on benchmark. A recruiter at 27% acceptance is 10 points below peers. The same number, opposite diagnosis.
Sender seniority barely changes outcomes
Across 13,302 senders, every seniority bucket lands within a 3-point band on acceptance rate. C-Level senders sit at 29.4%. Junior/Entry senders sit at 26.3%. Director, VP, and Manager-level senders fall between.
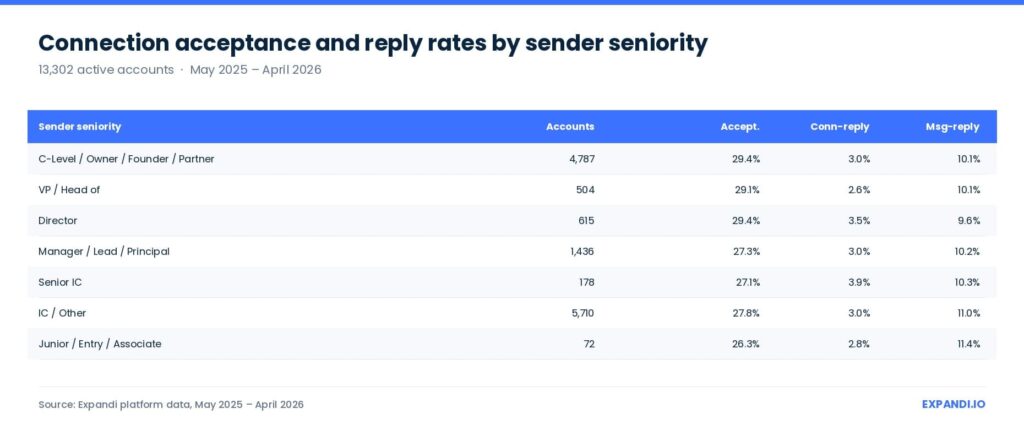
The widest spread sits on connection-request reply rate, where Directors (3.5%) and Senior ICs (3.9%) outperform by roughly a point. A plausible read: a connection note from a named specialist (“Director of RevOps at [Company]”) often reads as more relevant than the same note from an anonymous founder.
The conventional wisdom that C-level senders perform better because of title weight doesn’t hold in this dataset. C-Level acceptance is 29.4%; Manager-level acceptance is 27.3%. The gap is 2.1 points across 6.5 million connection requests. Recipient seniority matters enormously when targeting. Sender seniority barely changes the result.
The practical takeaway
Stop reserving outbound for the senior bench. A well-targeted, well-written message from a Manager performs almost identically to one from a CEO. Coaching content can be role-agnostic. The variables worth optimizing are upstream — who you target, what you say, when you reach them, and how the sequence is structured — not the sender’s title.
Company size doesn’t determine performance
82% of all Expandi outreach volume comes from companies with 200 or fewer employees. Across every company size bucket, acceptance rates run 26–29% and message reply rates run 9–11%. The data shows no meaningful pattern by headcount.
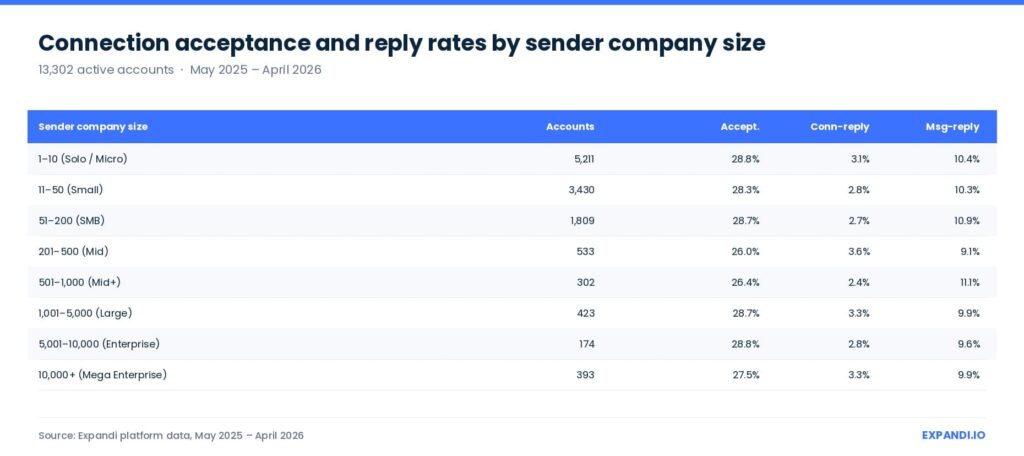
A 5-person startup achieves the same acceptance rate as a 10,000-person enterprise. There’s a 2–3 point dip in the 201–1,000 employee range on acceptance and message-reply rate, but it’s too small to act on for strategy purposes.
The implication
Stop benchmarking against company-size peers. A 50-person SaaS company hitting 28% acceptance is on the platform average, the same as a 50,000-person enterprise hitting 28%. The variables that change outcomes don’t include headcount.
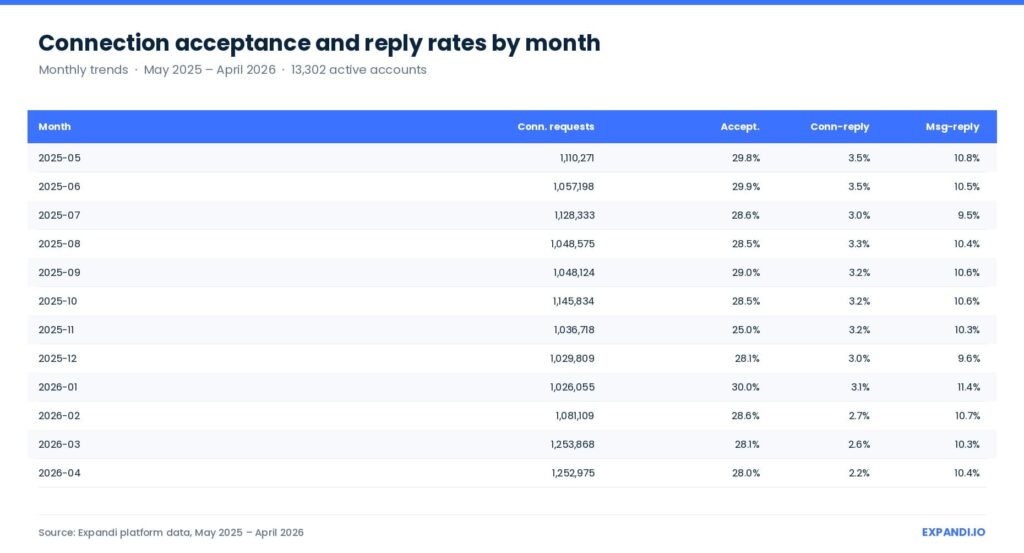
What changed in 12 months of monthly trends
Acceptance rate held stable at 28–30% across the year, with one dip to 25% in November 2025. Message reply rate held at 10–11%. Connection-request reply rate drifted from 3.5% (May 2025) to 2.2% (April 2026), a 37% relative decline.
Four observations.
Acceptance rate held stable. The 28–30% band held across eleven of twelve months. The single deviation, November 2025 at 25%, is worth flagging but not over-interpreting from a monthly view alone. Annual KPIs anchored at ~28–29% acceptance fit the data.
Connection-request reply rate is in a measurable decline. From 3.5% in May 2025 to 2.2% in April 2026. A 37% relative drop over twelve months is significant. Possible drivers include increasingly generic connection-note templates as more senders converge on similar phrasing, changes in how LinkedIn surfaces connection notes to recipients, or audience habituation. The dataset doesn’t isolate the cause, but the trend is consistent enough to plan around.
Message reply rate held flat at 10–11%. The conversation that happens after the connection is accepted shows no erosion. Message reply rates stayed within a stable 10–11% range across the year.
Volume grew without acceptance erosion. Monthly request volume rose from 1.11M (May 2025) to 1.25M (March–April 2026), about 13% growth. If the platform were saturating, acceptance rates would be expected to fall as overall outreach increased. They didn’t. The dataset doesn’t show saturation effects on acceptance over the period.
The connection-reply decline is the one finding that points to a clear strategy adjustment.
If your team relies on connection-note replies as a primary pipeline input, the input is shrinking. Warm-touch sequences — profile view, content engagement, then connect — counteract the trend by building familiarity before the request hits. [Smart Sequences](LINK: Smart Sequences feature page) is built around this structure.
What this means for your outreach strategy
Three takeaways the data supports.
1. Benchmark by your segment, not by the platform average. If your team is in Computer Software and hits 27% acceptance, you’re on benchmark for your industry. If your team is in Staffing & Recruiting and hits 27%, you’re 10 points below your peers. The 28.5% platform average is the wrong reference point for either team. Pull your industry row out of the table above and benchmark from there.
2. Stop optimizing variables that don’t change outcomes. Sender seniority and company size both fall in this category. The data shows a 2–3 point spread across every seniority bucket and every company size bucket. If your team is debating whether the CEO should send the requests, or whether enterprise outreach needs a different playbook than SMB outreach, the data says it won’t materially affect results. The variables that determine outcomes are upstream — who you target, what you say, when you reach them, and how the sequence is structured.
3. Plan for the connection-reply decline. Whatever caused the 3.5% → 2.2% drift over twelve months, the implication for outreach teams is the same: connection notes are returning less. Teams that rely on note replies as a pipeline input need a hedge. Two shifts make sense:
- Warm-touch sequences before the connection request. Profile view, content engagement, then connect. This raises the chance the recipient recognizes the sender’s name before deciding to accept.
- Post-connection messaging as the primary reply lever. Message reply rate held flat at 10.4% across the year.
Per-request, the two pathways are roughly even right now: at platform averages, 100 connection requests statistically correspond to about 3 connection-note replies and roughly 3 post-connection message replies over time (at the current 3.0% rate).
Once those 28 acceptances convert at 10.4%, another ~3 message replies. But only one of those pathways is stable. Connection-note replies dropped 37% over the year. Message replies didn’t move. The lever worth investing in is the one that isn’t shrinking, and that compounds when you run multi-step sequences against the accepted base, where the 10.4% applies to every touchpoint.
The Campaign Builder is the visual flow tool where these sequences get assembled — actions on one axis (profile view, post like, follow, connection request, message, follow-up, email) and conditions on the other (If connected, If visited your profile, If post liked, If email opened, and five others), with branches routing prospects based on what they do.
This is what Smart Sequences refers to: the conditional logic that reroutes a flow when prospect behavior doesn’t match a linear schedule. The warm-touch flow described above — profile view, then content engagement, then connect, then post-connection message — runs inside a single Builder campaign rather than three tools coordinated by hand.
Signals sits at the front of that flow. Instead of importing a cold list, the Signals action adds prospects to a campaign automatically when they visit your profile, visit your company page (both LinkedIn Premium / Sales Navigator-gated), or engage with a specified post. An ICP filter screens the inbound — wrong seniority, wrong industry, too small — before anyone enters the sequence.
The downstream message can then reference what the prospect actually did, which is the relevance lift that moves outcomes above the 10.4% baseline.
Try Expandi on your own outreach
These benchmarks come directly from Expandi’s platform.
The 13.2 million connection requests, 6.7 million outbound messages, and 3.7 million accepted connections in this report were all sent through Expandi accounts between May 2025 and April 2026.
Start a 7-day free trial and see where your outreach lands against the segment data above.
FAQs about LinkedIn outreach benchmarks
It depends on what you’re optimizing for. Expandi’s 2026 data shows connection-note reply rates dropping from 3.5% to 2.2% over the past twelve months — a 37% relative decline. The note pathway is weakening as a pipeline input. Senders relying on note replies should hedge toward post-connection messaging, which held flat at 10.4% reply rate across the same period. Whether to include a note at all is less important than which pathway you’re building your pipeline around.
Platform-wide acceptance held stable at 28–30% across Expandi’s 13.2M-request dataset over the past twelve months, so a dropping acceptance rate is usually a sender-side variable, not a platform shift. Common drivers: ICP drift (targeting widening to lower-fit prospects), profile signal weakening (no recent posts, outdated headline), message template fatigue (a hook that worked six months ago is saturated now), or industry-specific patterns. Check your segment row in the industry table — a 27% acceptance rate is on-benchmark for Software and 10 points below benchmark for Staffing & Recruiting.
The Expandi platform average is 10.4% for outbound messages (welcome messages, follow-ups, group messages, event messages, InMails, and emails). Staffing & Recruiting leads at 18.9%; Computer Software sits at 8.8%. A reply rate above 12% indicates strong targeting and messaging. Below 8% usually signals a targeting or relevance issue, not a wording problem.
Yes. Expandi’s data shows connection-request reply rate dropped from 3.5% in May 2025 to 2.2% in April 2026 — a 37% relative decline. Possible drivers include generic connection-note templates, changes in LinkedIn’s note visibility, or audience habituation. Teams relying on connection-note replies should consider warm-touch sequences and post-connection messaging as a hedge.
Expandi enables up to 300 weekly connection requests per LinkedIn account, including Mobile Connector campaigns. Volume without targeting doesn’t move outcomes — the industries with higher acceptance rates don’t necessarily send more requests, they send more relevant ones. Start at 100–150 per week, benchmark against your segment, and scale once acceptance is holding above your industry average.
Methodology
All rates calculated from Expandi production data, May 1, 2025 through April 30, 2026.
Connection acceptance rate = accepted connections / total connection requests sent (including mobile and CSV-uploaded). Connection-request reply rate = replies to the connection-request note / total connection requests sent. Message reply rate = replies to outbound messages / total outbound messages sent. The three metrics are independent; they share no events between numerator and denominator. Coverage: 94% of volume has industry mapped; 6% is “Unknown” (sender account has no linked LinkedIn company).
This is a sender-side benchmark. It answers what outcomes users in a given industry, seniority, or company size segment achieve when running outreach on Expandi. It does not project performance by recipient industry, seniority, or size — that would require a contact-side analysis on a separate dataset.
Appendix: Full industry breakdown
The complete data across all industries with meaningful sample sizes. Industries with fewer than 10,000 connection requests in the period are aggregated into “All others” so totals reconcile to the platform headline.
| Industry | Accounts | Conn. requests | Accept. | Conn-reply | Msg-reply |
|---|---|---|---|---|---|
| Computer Software | 1,851 | 1,831,933 | 27.5% | 2.8% | 8.8% |
| Information Technology & Services | 1,825 | 1,731,259 | 28.4% | 2.6% | 10.5% |
| Marketing & Advertising | 1,115 | 1,038,187 | 29.4% | 2.4% | 10.6% |
| Management Consulting | 976 | 1,029,342 | 28.0% | 3.1% | 9.2% |
| Professional Training & Coaching | 471 | 806,144 | 27.4% | 4.2% | 8.6% |
| Unknown | 1,054 | 791,741 | 28.9% | 3.4% | 10.5% |
| Financial Services | 767 | 732,855 | 26.0% | 2.2% | 10.3% |
| Staffing & Recruiting | 462 | 423,792 | 36.5% | 6.6% | 18.9% |
| Real Estate | 253 | 277,414 | 28.4% | 2.7% | 11.8% |
| Human Resources | 213 | 260,081 | 30.5% | 4.2% | 9.7% |
| Internet | 330 | 248,164 | 28.2% | 2.6% | 10.0% |
| Design | 118 | 148,589 | 31.3% | 3.0% | 10.5% |
| Accounting | 113 | 138,854 | 29.5% | 2.6% | 12.0% |
| Hospital & Health Care | 159 | 135,687 | 27.7% | 3.4% | 10.6% |
| Venture Capital & Private Equity | 107 | 135,376 | 34.9% | 5.5% | 11.0% |
| Media Production | 78 | 127,799 | 23.4% | 1.9% | 7.2% |
| Health, Wellness & Fitness | 107 | 118,110 | 25.1% | 2.5% | 9.9% |
| Construction | 119 | 117,715 | 26.9% | 2.5% | 11.4% |
| E-learning | 98 | 110,003 | 28.4% | 2.8% | 7.4% |
| Computer & Network Security | 140 | 107,864 | 26.0% | 1.9% | 10.7% |
| Transportation / Trucking / Railroad | 83 | 103,286 | 28.6% | 3.6% | 10.9% |
| Logistics & Supply Chain | 72 | 93,652 | 32.3% | 3.4% | 11.8% |
| Insurance | 119 | 93,274 | 28.1% | 2.4% | 8.8% |
| Events Services | 107 | 87,027 | 31.5% | 2.3% | 13.8% |
| Mechanical / Industrial Engineering | 87 | 86,407 | 29.5% | 2.3% | 10.9% |
| Information Services | 76 | 75,671 | 31.6% | 2.7% | 11.2% |
| Biotechnology | 68 | 74,913 | 25.8% | 2.9% | 8.3% |
| Non-profit Organization Mgmt | 83 | 73,905 | 29.7% | 5.0% | 8.0% |
| Facilities Services | 46 | 72,265 | 23.2% | 2.1% | 9.6% |
| Retail | 59 | 70,483 | 34.3% | 3.2% | 16.9% |
| Education Management | 44 | 67,059 | 25.2% | 5.3% | 11.1% |
| Telecommunications | 61 | 66,663 | 21.8% | 1.8% | 11.2% |
| Outsourcing / Offshoring | 109 | 66,034 | 26.1% | 2.2% | 9.2% |
| Consumer Services | 43 | 65,393 | 31.2% | 4.2% | 10.6% |
| Medical Device | 55 | 63,946 | 26.3% | 2.5% | 8.9% |
| Electrical / Electronic Manufacturing | 51 | 60,334 | 29.0% | 2.9% | 12.1% |
| Food & Beverages | 63 | 60,269 | 27.5% | 2.0% | 13.9% |
| Renewables & Environment | 64 | 53,569 | 26.3% | 2.2% | 12.5% |
| Machinery | 56 | 52,233 | 26.8% | 2.3% | 9.0% |
| Writing & Editing | 22 | 50,862 | 35.1% | 7.1% | 6.7% |
| Industrial Automation | 42 | 48,800 | 31.2% | 3.2% | 9.6% |
| Sports | 34 | 45,367 | 34.5% | 3.2% | 15.0% |
| Higher Education | 57 | 44,617 | 26.4% | 2.6% | 11.6% |
| Consumer Goods | 50 | 43,878 | 27.3% | 2.5% | 11.6% |
| Semiconductors | 25 | 43,608 | 30.3% | 0.7% | 15.2% |
| Mental Health Care | 43 | 42,252 | 26.9% | 2.5% | 15.7% |
| Oil & Energy | 30 | 41,529 | 28.1% | 4.1% | 12.0% |
| Automotive | 60 | 40,896 | 26.4% | 2.9% | 11.0% |
| Hospitality | 42 | 40,474 | 28.0% | 3.7% | 14.5% |
| Environmental Services | 44 | 39,158 | 25.0% | 1.8% | 11.3% |
| Apparel & Fashion | 28 | 39,083 | 19.9% | 1.5% | 7.1% |
| Security & Investigations | 42 | 35,992 | 31.4% | 2.2% | 15.0% |
| Entertainment | 28 | 35,618 | 27.7% | 2.4% | 8.2% |
| Research | 31 | 32,848 | 26.7% | 2.9% | 7.0% |
| Business Supplies & Equipment | 36 | 31,784 | 28.9% | 2.7% | 12.6% |
| Packaging & Containers | 34 | 31,599 | 25.7% | 1.8% | 16.8% |
| Law Practice | 37 | 30,645 | 35.4% | 2.4% | 14.4% |
| Public Relations & Communications | 29 | 30,271 | 34.3% | 4.1% | 11.0% |
| Investment Banking | 35 | 29,296 | 29.9% | 3.1% | 10.2% |
| Government Administration | 44 | 27,164 | 30.2% | 4.8% | 10.4% |
| Consumer Electronics | 16 | 27,078 | 17.5% | 2.5% | 6.0% |
| Publishing | 21 | 23,834 | 29.9% | 4.0% | 8.0% |
| Printing | 24 | 23,596 | 31.2% | 1.5% | 10.9% |
| Architecture & Planning | 27 | 23,540 | 23.9% | 1.2% | 14.4% |
| Online Media | 24 | 23,111 | 34.4% | 2.6% | 11.1% |
| Market Research | 34 | 23,018 | 26.9% | 3.3% | 11.1% |
| Wholesale | 26 | 21,163 | 25.8% | 2.9% | 13.7% |
| International Trade & Development | 23 | 20,491 | 27.3% | 2.0% | 12.5% |
| Legal Services | 22 | 19,970 | 30.0% | 2.7% | 12.3% |
| Commercial Real Estate | 26 | 19,431 | 23.0% | 1.3% | 12.6% |
| Chemicals | 16 | 18,631 | 31.4% | 3.0% | 9.5% |
| Pharmaceuticals | 30 | 18,243 | 31.1% | 2.6% | 17.4% |
| Public Safety | 10 | 18,018 | 31.4% | 2.7% | 13.8% |
| Leisure, Travel & Tourism | 22 | 17,855 | 30.4% | 1.0% | 19.1% |
| Think Tanks | 19 | 16,894 | 32.7% | 4.6% | 10.5% |
| Investment Management | 27 | 16,295 | 32.9% | 4.6% | 17.1% |
| Defense & Space | 12 | 16,208 | 19.4% | 1.7% | 12.6% |
| Program Development | 13 | 16,162 | 24.9% | 0.7% | 8.8% |
| Building Materials | 13 | 16,028 | 23.9% | 2.3% | 15.6% |
| Food Production | 12 | 15,358 | 27.4% | 2.7% | 15.1% |
| Fundraising | 9 | 14,944 | 29.0% | 0.9% | 7.2% |
| Banking | 24 | 14,516 | 27.1% | 3.0% | 15.6% |
| Utilities | 20 | 13,916 | 27.5% | 3.9% | 12.5% |
| Medical Practice | 8 | 12,461 | 20.3% | 0.3% | 18.5% |
| Computer Games | 13 | 12,221 | 23.1% | 1.6% | 13.9% |
| Civil Engineering ⚠ | 13 | 12,108 | 39.9% | 7.4% | 25.5% |
| Maritime | 7 | 11,168 | 24.6% | 2.3% | 7.6% |
| Cosmetics | 8 | 10,447 | 24.7% | 0.9% | 17.1% |
| Broadcast Media ⚠ | 14 | 10,415 | 40.1% | 4.2% | 7.9% |
| All others (51 industries, <10K requests each) | 274 | 208,716 | 29.9% | 2.9% | 10.8% |
| TOTAL | 13,302 | 13,218,869 | 28.5% | 3.0% | 10.4% |
⚠ Sample size too small (≤15 accounts) for the figures to be reliable; treat as directional.
You’ve made it all the way down here, take the final step