Sales forecasting methods:7 methods to predict your sales for permanent growth

You can build a forecast three different ways and get three different numbers. If you pick the wrong method for your data and you’ll either over-hire against revenue that never lands or miss the quarter you could have staffed for.
This guide walks through the sales forecasting methods that actually hold up, when each one fits, and how to project revenue from the pipeline and outreach data you already have.
Key Takeaways
Sales forecasting methods split into two families: qualitative (expert judgment) and quantitative (historical data and statistics). Qualitative methods fit new products and thin data; quantitative methods fit stable, data-rich pipelines. Sales teams often run more than one and cross-check the numbers. The right choice comes down to how much clean historical data you hold, how far out you’re forecasting, and how volatile your market is.
Sales forecasting methods:7 methods to predict your sales for permanent growth


Why sales forecasting matters for outbound teams
A sales forecast is an estimate of the revenue you expect to close over a defined period, built from pipeline data, historical patterns, or both. For outbound teams, it does four concrete jobs:
- Resource allocation. Anticipated sales volume tells you how many reps, how much budget, and what inventory to line up against future demand.
- Budgeting and financial planning. Revenue projections feed target-setting, cash-flow management, and investment timing.
- Pipeline management. A forecast exposes bottlenecks and shows where deals stall, so reps prioritize the opportunities most likely to close.
- Performance and accountability. Comparing actual results against the forecast turns into a benchmark you can coach against and set realistic quotas from.
Get the forecast right and every downstream decision, like hiring, spend, quota, rests on a firmer number.
What are the different types of sales forecasting methods?
Sales forecasting methods fall into two categories.
- Qualitative methods rely on expert judgment, opinion, and experience — useful when historical data is thin or the market is shifting.
- Quantitative methods use historical data and statistical models, useful when you have a clean, sufficient dataset and reasonably stable patterns.
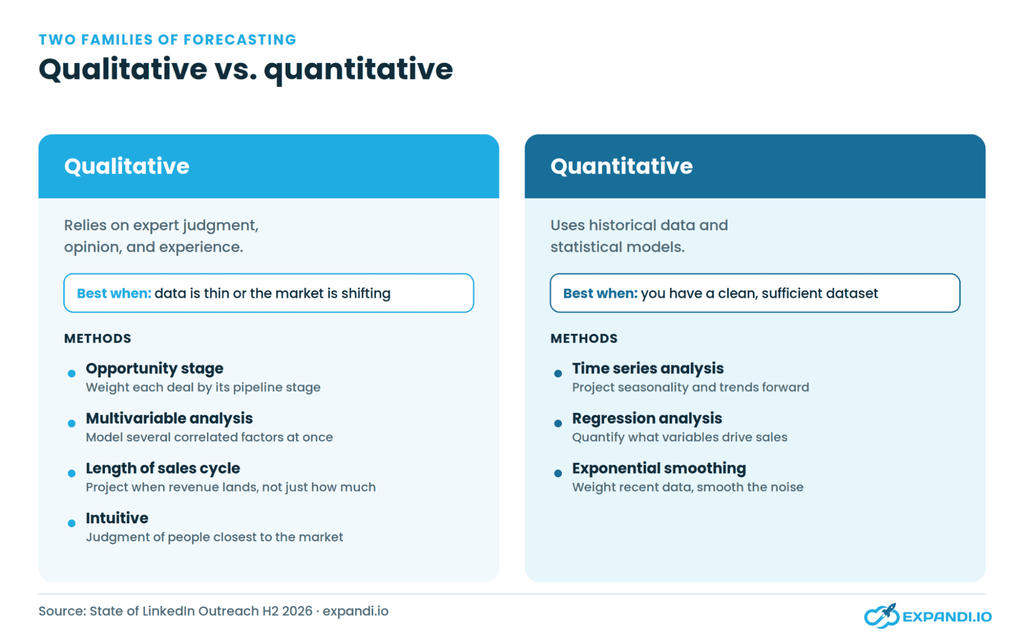
Here’s every method in this guide side by side, so you can match one to your situation before reading the detail.
Sales forecasting methods compared
| Method | Type | Best for | Data needed | Forecast horizon | Main limitation |
|---|---|---|---|---|---|
| Opportunity stage | Qualitative | Teams with a defined sales process | Stage-by-stage close rates | Short–medium | Needs clearly defined stages; ignores external factors |
| Multivariable analysis | Qualitative | Data-rich teams wanting nuance | Multiple correlated variables | Medium | Complex to build; needs statistical skill |
| Length of sales cycle | Qualitative | Teams with consistent cycle times | Historical cycle duration by stage | Short–medium | Unreliable if cycle length varies widely |
| Intuitive | Qualitative | New products, limited data | Expert knowledge | Any | Subjective; prone to individual bias |
| Time series analysis | Quantitative | Stable, seasonal sales patterns | Consistent historical sales | Short | Breaks down in volatile markets |
| Regression analysis | Quantitative | Multiple factors drive sales | Historical data + variables | Long | Assumes linear relationships |
| Exponential smoothing | Quantitative | Smoothing short-term noise | Recent historical sales | Short | Weak for long-term; assumes stable patterns |
The sections below break down each of these sales forecasting techniques, with a worked example and the trade-offs in a quick-scan table.
Qualitative sales forecasting methods
Qualitative sales forecast methods rely on subjective opinion and expert judgment rather than statistical analysis. Teams reach for them when historical data is limited, when a product is new, or when the market is changing faster than the numbers can track.
1. Opportunity stage forecasting
Opportunity stage forecasting predicts the likelihood of closing a deal at each point in your sales process, then rolls those probabilities up into a revenue projection. Instead of guessing total sales, you weight each open deal by its stage.
Example: A company selling project-management software runs a process with four stages: prospecting, product demo, negotiation, and contract signing. Historical data shows that 7 of 10 prospects who reach negotiation end up signing. With 10 deals in negotiation, the team forecasts roughly 7 closes from that stage and allocates extra support to the highest-probability deals.
| Pros | Cons |
|---|---|
| Prioritizes reps toward deals most likely to close | Requires a well-defined process with clear stages |
| More accurate because it accounts for each stage | Tracking and updating every opportunity is time-consuming |
| Surfaces bottlenecks in the sales process | Ignores external factors like competition or market shifts |
2. Multivariable analysis forecasting
Multivariable analysis uses several factors at once — market trends, customer behavior, economic indicators, marketing activity — to predict future sales, rather than relying on historical sales figures alone. It’s the most nuanced qualitative method and the most demanding to build.
Example: A CRM software company gathers historical sales, industry trends, customer sentiment, and economic indicators, then uses statistical techniques to model how those variables move together. If rising market demand and positive sentiment correlate with higher sales, the model factors both into its projection.
| Pros | Cons |
|---|---|
| Captures the interplay of multiple factors | Requires careful variable selection and clean data |
| Shows which variables drive sales most | Harder to implement than single-factor methods |
| Supports targeted resource allocation | Collecting data across sources is time-consuming |
3. Length of sales cycle forecasting
This method estimates how long a deal takes to move from first contact to close, then uses that timeline to project when revenue will land. It answers when, not just how much.
Example: A project-management software company analyzes past cycles and finds it takes roughly three weeks from first contact to demo, two from demo to negotiation, and two more to signing. For a new deal entering at first contact, the team can project a close date about seven weeks out and plan resourcing around it.
| Pros | Cons |
|---|---|
| Helps plan headcount, campaigns, and cash flow | Unreliable when historical data is thin |
| Flags where leads get stuck in the pipeline | Ignores external factors that shift cycle length |
4. Intuitive forecasting
Intuitive (or judgmental) forecasting relies on the experience and judgment of people close to the market: sales managers, customer success, product specialists — to predict outcomes. It’s the fallback when there isn’t enough data to model.
Example: A customer-support software company convenes its sales and CS leads. They weigh current competition, emerging trends, and customer feedback, then produce a forecast grounded in their collective read of the market rather than a statistical model.
| Pros | Cons |
|---|---|
| Captures qualitative insight numbers miss | Forecasts vary widely between individuals |
| Adapts fast to changing conditions | Subjective and exposed to personal bias |
Quantitative sales forecasting methods
Quantitative methods use mathematical models and historical data to generate projections. They work best when you have a clean, sufficient dataset and reasonably consistent patterns — and less well when data is thin or the drivers of sales are hard to quantify.
5. Time series analysis
Time series analysis uses historical data to find patterns and trends over time — seasonality, cycles, steady growth — and projects them forward. It fits short-term forecasting where sales patterns stay consistent and few external factors interfere.
Example: An HR software company pulls several years of monthly sales, spots a recurring seasonal lift in certain months, and projects the coming quarter from those patterns plus any known upcoming changes.
| Pros | Cons |
|---|---|
| Reveals seasonal patterns and trends | Breaks down in volatile, fast-changing markets |
| Strong for short-term forecasting | Misses external factors like new competition |
| Gives a baseline to measure actuals against | Only as accurate as the underlying historical data |
6. Regression analysis forecasting
Regression analysis quantifies the relationship between sales and one or more variables — marketing spend, customer satisfaction, web traffic — and uses those relationships to project future sales. It suits long-term forecasting where multiple factors drive the number.
Example: A project-management tool company models five years of sales against marketing spend, satisfaction scores, and traffic. Finding that spend and satisfaction both correlate with sales, it builds a model to project revenue five years out from expected values of each input.
| Pros | Cons |
|---|---|
| Identifies and quantifies what drives sales | Assumes relationships are linear when they may not be |
| Strong for long-term forecasting | Needs accurate, complete historical data |
| Helps prioritize the highest-impact levers | Sensitive to outliers and missing variables |
7. Exponential smoothing
Exponential smoothing generates a forecast from a weighted average of past sales, giving more weight to recent data. It smooths short-term noise and fits short-term forecasting where patterns are stable.
Example: A subscription-based LinkedIn automation company (like Expandi) forecasts next quarter’s monthly sales from two years of history. The method weights recent months more heavily, filtering out seasonal spikes to surface the underlying trend.
| Pros | Cons |
|---|---|
| Effective for short-term forecasting | Weak for long-term predictions |
| Smooths out seasonal and promotional noise | Assumes sales patterns stay stable |
| Simple to run in a spreadsheet | Sensitive to the initial values you choose |
How do you choose the right sales forecasting method?
There’s no single best method. The right one depends on your data and your goal. Run this checklist before committing:
- Data availability. Rich, clean history points to quantitative methods (time series, regression). Thin or unreliable data points to qualitative ones (intuitive, opportunity stage).
- Forecasting horizon. Short-term (weeks to a quarter) suits time series and exponential smoothing. Long-term (quarters to years) suits regression.
- Accuracy required. Quantitative methods give tighter numerical forecasts; qualitative methods give broader directional reads with more uncertainty.
- Data patterns. Clear seasonality or correlations favor time series or regression. No discernible pattern favors qualitative methods or simple moving averages.
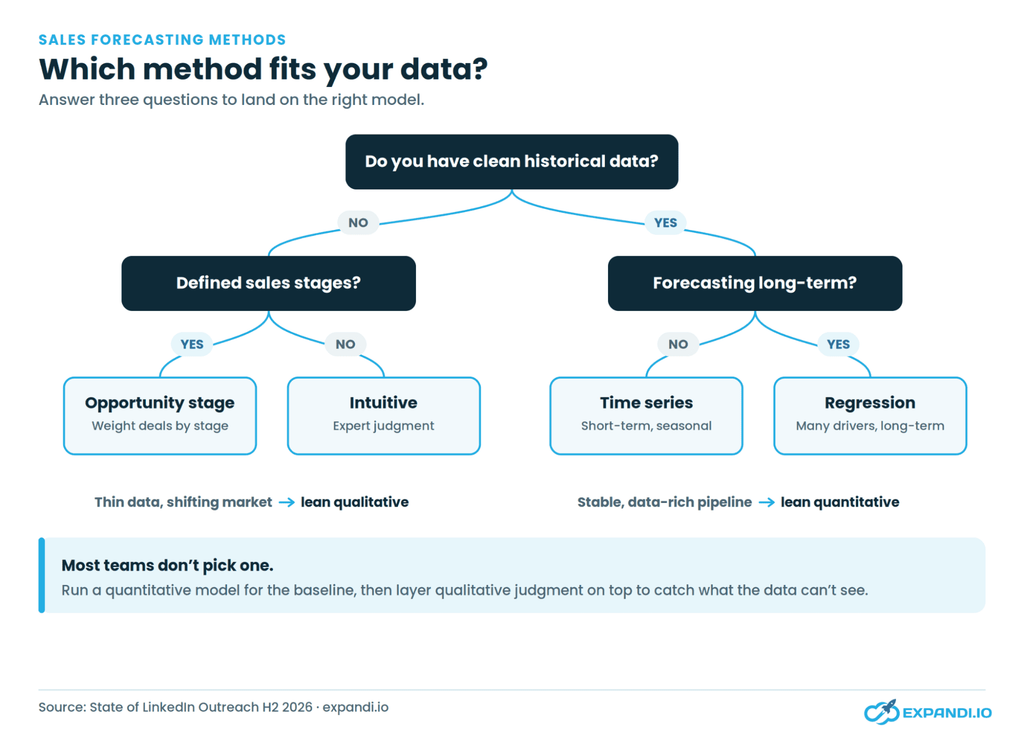
Most teams don’t pick one. They run a quantitative model for the baseline and layer qualitative judgment on top to catch what the data can’t see.
What metrics can help sales projections?
Forecasting gets easier when you track the right inputs. These are the metrics that feed a sales projection most directly:
- Outbound lead generation metrics — number of leads generated, conversion rates, and lead quality. Together they estimate the volume of opportunities entering the pipeline. If you run outbound on LinkedIn, Expandi’s reporting tracks leads generated, cycles, and close rates you can project from.
- Sales funnel metrics — opportunities at each stage, stage-to-stage conversion rates, average deal size, and cycle length. These read the health of the pipeline.
- Customer acquisition cost (CAC) — the cost to win a new customer, which grounds how much future growth actually costs to buy.
- Churn and retention rates — the percentage of customers lost and kept, which directly moves net revenue and has to be factored into any projection.
- Average sales cycle length — longer cycles delay revenue recognition; shorter ones pull it forward.
- Seasonality and time factors — peak and low-demand periods, plus month-over-month and year-over-year growth rates.
- Economic indicators — GDP growth, unemployment, interest rates, and consumer confidence, which shape overall spending behavior.
How can you improve your sales forecasting?
A forecast is only as good as the discipline behind it. Five practices that raise accuracy:
- Involve your sales team. Reps sit closest to the buyer and see shifts in sentiment and competition before the data does. Fold their read into the model.
- Analyze historical data properly. Look for consistent cycles, growth rates, and seasonality as the base for projections. If you run LinkedIn outreach, analyzing historical response rates by period lets you adjust send volume and predict downstream pipeline.
- Segment and validate. Break sales down by product line, customer segment, or region and forecast each separately. Blended numbers hide the variation that matters.
- Use more than one method. Cross-check a quantitative baseline against qualitative judgment. Where they diverge, you’ve found a question worth answering before you commit.
- Review and update on a cadence. Markets move. Refresh forecasts on a set schedule so they reflect current data instead of last quarter’s assumptions.
Our picks for the best sales forecasting tools
The right tool depends on how much of your forecasting is manual versus modeled. Here’s where each type fits.
CRM software
Platforms like Salesforce, HubSpot, or Zoho include built-in forecasting and give you a central store of pipeline and revenue data. If LinkedIn is a primary channel, connecting outreach activity to your CRM keeps the pipeline data feeding your forecast clean and current.
Sales analytics software
Tools like Tableau, Microsoft Power BI, or InsightSquared layer advanced analytics and visualization on top of CRM data, surfacing trends and generating forecasts from historical patterns.
Sales engagement and outreach platforms
This is where your forecast meets the top of the funnel. Expandi runs signal-based LinkedIn and email outreach and reports on the metrics that feed a projection — reply rates, campaign performance, and lead volume.
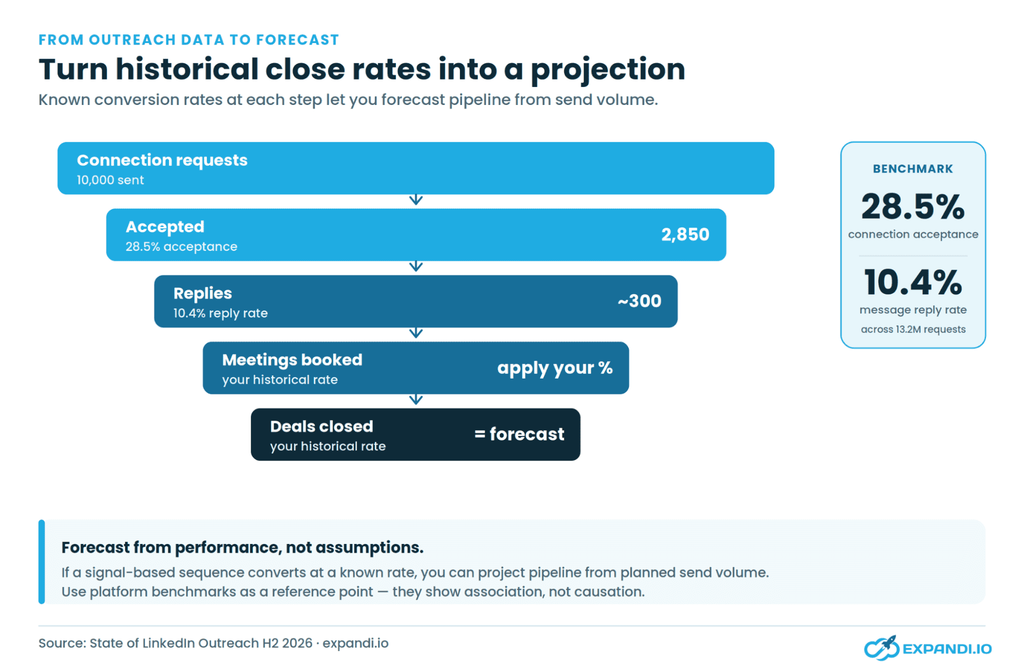
Analyzing historical closing rates from your cold outreach gives you a grounded input for projecting future sales: if a signal-triggered sequence converts at a known rate, you can forecast pipeline from send volume rather than guessing.
Reply-rate benchmarks from our State of LinkedIn Outreach report — 28.5% connection acceptance and 10.4% message reply across 13.2 million requests — give you a reference point to sanity-check your own numbers against.
For teams that also need to find and qualify accounts before they hit a sequence, a dedicated B2B prospecting tool sits upstream of the outreach layer.
AI-assisted forecasting
AI forecasting tools now sit inside most major CRMs and analytics platforms, scoring deals and projecting revenue from patterns a manual model would miss.
A newer option: connecting an AI assistant to your CRM through MCP (Model Context Protocol), so it can read live pipeline data and answer forecasting questions directly against your own numbers. If you go this route, treat data access and permissions carefully — see our guide to MCP security best practices before connecting anything to production data.
Spreadsheets
Excel and Google Sheets stay the default for custom models: flexible, familiar, and enough for exponential smoothing or a simple regression when you don’t need dedicated software.
Dedicated forecasting software
Tools like Anaplan or Adaptive Insights handle scenario modeling, collaboration, and advanced algorithms for teams that have outgrown spreadsheets and need forecasts that incorporate many variables at once.
Turn your outreach data into a forecast you can trust
Even a sharp forecast can miss — but the fix is a fuller top of funnel, not a fancier model. The more qualified pipeline you generate, the less any single missed deal matters.
Expandi runs automated LinkedIn and email sequences off real buying signals, and reports the reply, conversion, and close-rate data you need to project future sales from actual performance instead of assumptions. Want to see the numbers your own outreach would produce?
Start your Expandi free trial and build your next forecast on real pipeline data.
FAQs about sales forecasting methods
The three most common are time series analysis (projecting patterns and seasonality from historical data), regression analysis (modeling how variables like spend and satisfaction relate to sales), and qualitative forecasting (using expert judgment, surveys, or the Delphi method when data is limited). Teams often combine them depending on data availability and forecast horizon.
The two families are qualitative and quantitative. Qualitative forecasting draws on subjective judgment, expert opinion, and market research — best when data is thin or the market is shifting. Quantitative forecasting uses historical data and statistical models like time series, regression, and exponential smoothing — best when you have a clean, sufficient dataset.
No method is universally most accurate — accuracy depends on your data and horizon. Quantitative methods like regression and time series produce tighter numerical forecasts when you have strong historical data. For new products or volatile markets, qualitative methods often read reality better. Running both and cross-checking usually beats relying on a single method.
Start with your historical conversion rates. If a signal-based sequence reliably converts a known percentage of sends into replies, replies into meetings, and meetings into deals, you can project pipeline from planned send volume. Tracking those rates by period — which outreach platforms like Expandi report — turns raw activity into a defensible projection instead of a guess.
Update on a fixed cadence rather than only when something breaks — monthly is common, weekly for fast-moving pipelines. Refresh whenever a major input shifts too: a new competitor, a pricing change, or a swing in conversion rates. A stale forecast quietly drifts from reality and misleads every decision built on it.
AI forecasting tools can surface patterns and score deals faster than a manual model, and most major CRMs now include them. Connecting an AI assistant to your CRM via MCP lets it forecast against live pipeline data directly. The gain is speed and pattern-spotting; the caveat is that AI forecasts still depend on clean input data and careful handling of access and permissions.




You’ve made it all the way down here, take the final step