What is Data Enrichment and How to Use It in Your Sales Process

No sales strategy can yield successful results without the right kind — and amount — of data. Therefore, one of the key challenges for sales teams nowadays is to gather accurate and relevant information about their prospects and customers.
This is where data enrichment comes into play.
In this article, we will explore what data enrichment is, how it can benefit your sales process, and how to effectively utilize it for improved results.

What is Data Enrichment?
As the name suggests, data enrichment is the practice of enhancing your existing customer data by adding more information to it from external sources. It is the process of integrating third-party data about your customers into your raw data from primary sources.
We will go over the specific goals and benefits of data enrichment in outbound sales below, but for now, here are some of them:
- Collecting data about your ICP — enriching your data is primarily about gathering insights into the characteristics, behaviors, and preferences of your target audience. With enriched data, your sales team can better understand the key attributes that define your ICP and align their outreach efforts accordingly.
- Improved targeting (segmentation) — data enrichment allows for more precise targeting and segmentation of your prospect lists. Proper segmentation enables your sales team to tailor their messaging and offers to each segment’s unique needs and challenges. Sending more targeted and relevant communications increases the chances of capturing the attention and interest of your prospects.
- Personalization — using the additional information obtained through data enrichment, such as social media profiles, contact information, and email addresses, your team can craft personalized messages tailored to each prospect. Personalized outreach is more likely to resonate with prospects, resulting in higher engagement rates.
- Enhanced lead qualification — data enrichment helps provide better insights into a prospect’s characteristics and behavior, which enables your sales team to assess their suitability as a qualified lead. Enhanced lead qualification helps your team prioritize their efforts and focus on prospects with a higher likelihood of conversion.
If you choose the right communication channel with your prospects, you have a greater chance of receiving a response and building meaningful connections. If your leads use LinkedIn on a daily basis, send them LinkedIn messages. If they prefer communicating via phone, simply give them a call.
Data enrichment empowers sales teams to personalize their outreach messages based on the extra information they have at their disposal. Enriched data provides a better view into prospects’ characteristics and preferences, which helps sales professionals craft tailored messages that resonate with the recipients.
If you only know the prospect’s name, you won’t get further than a simple “Hi [First name]” message. But if you have more details like their name, the LinkedIn event they’re attending soon, and their company name, you can create a super personalized cold message.
Check this out:
Hey [First name], I noticed we’ll be at the same LinkedIn event [+ link here] soon. I’m also interested in [Event name] and would love to connect with likeminded people. By the way, I saw you work at [Company name]. Can you share how your company tackles [the challenge related to the event topic]? We’re facing the same challenge at Expandi, and I’d really appreciate your professional advice.
See the difference? With enriched data, you can create a message that shows you’ve done your homework and genuinely want to connect. Using enriched data is all about building that trust and getting valuable insights from the right people.
For example, knowing the technologies or tools a company uses allows sales teams to highlight how their solution integrates seamlessly or offers advantages over the existing systems.
Types of data enrichment

Although there are many different types of data enrichment methods that you may run into while exploring this subject, the following may be the most universally relevant:
- Firmographic enrichment — this type of enrichment focuses on adding business-related details, such as company size, industry, location, revenue, and technology stack. Firmographic data helps in segmenting and targeting prospects based on specific criteria.
A popular tool used for this kind of business data enrichment is Clearbit. Once integrated with your CRM, Clearbit automatically enriches raw data related to your contacts and leads by adding numerous additional data attributes to “round out” each contact or lead. The additional firmographic attributes include location, company size, estimated annual revenue, industry and sub-industry, and social media accounts.
- Technographic enrichment — technographic data provides insights into the technology and tools a company uses. It helps tailor their approach based on a prospect’s existing technology stack and identify opportunities where their solution can integrate seamlessly.
One tool that can be used for this is BuiltWith, one of the leading data enrichment services which provides technographic data within its vast database of over 50,000 technologies available to search.
- Demographic enrichment — demographic data enrichment enhances customer profiles with information such as age, gender, income, education level, and geographic data. It enables sales teams to segment customers and personalize their messaging based on specific characteristics.
Again, a great tool to use for enriching data in this way is Clearbit, which enhances your customer data with attributes like place of residence, occupation, employment status, family size, household income, marital status, ethnicity, education level, and home ownership.
- Psychographic enrichment — psychographic data focuses on understanding the interests, attitudes, and behaviors of prospects and customers. This information helps tailor marketing and sales strategies to effectively resonate with target audiences.
A particularly helpful tool for this type of enrichment would be Crystal Knows. This data enrichment service is able to enhance your customer profiles through personality data posted by customers online, as well as data posted about them by others. The data is mined from user and peer reviews, LinkedIn accounts, Google search results, Facebook pages, and blog posts.
How Data Enrichment Helps in Sales
So, how does all the data enrichment contribute to bettering the sales process? Here are some of the main ways.
Improved lead generation and qualification
First off, data enrichment helps improve lead generation and lead qualification through the following:
- Enhanced lead identification. Data enrichment helps sales reps identify potential leads that align with their ideal customer profile by filtering prospects based on specific criteria. This targeted approach ensures that sales teams focus their resources on leads that are more likely to convert, resulting in a higher quality lead pipeline.
- Deeper understanding of prospects. Enriched data can reveal valuable insights about a prospect’s preferences and behavioral patterns, which can help establish rapport and build trust with prospects during the qualification process.
- Improved lead scoring. Data enrichment helps sales reps assign scores or ratings to leads based on factors such as company size, revenue, industry influence, or purchase intent. This helps prioritize follow-up activities and focus efforts on leads with the highest likelihood of conversion.
Data enrichment example:
Wouldn’t it be amazing if you could send cold messages to people who are interested in your product? Well, you can! By combining LinkedIn lead generation tools with website trackers, you can convert your website visitors into potential customers. However, data enrichment is crucial for this process.
How to do it?
Let’s start from the beginning:
Step #1: Install a website visitor tracking tool.
Website trackers work by tracking IP addresses. When devices are connected to a specific network, they share the same IP address.
For example, individuals working within the same company are likely to have the same IP address. While tracking tools do not reveal the specific IP address, they can indicate when someone from a certain company has visited your website.
Step #2: Identify and filter companies that fit your ICP.
The data you receive is related to the company, such as the company name, URL, and the number of employees. This information is useful for finding companies that fit your Ideal Customer Profile (ICP). However, it doesn’t provide details about whom to communicate within these companies.
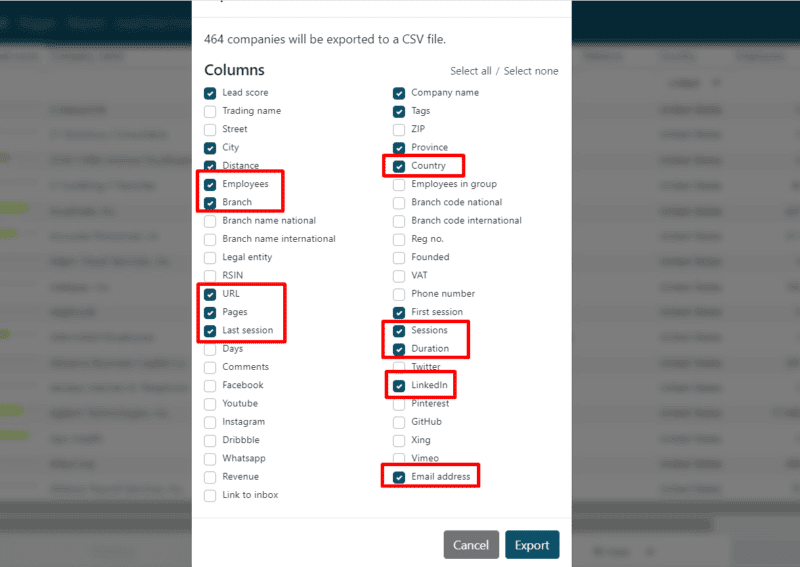
No worries, data enrichment can help you with that. You can use the data you have to find the missing LinkedIn company page URLs and the LinkedIn profiles of the company’s employees. This additional data will enable you to connect with the right individuals.
Step #3. Find employees with job titles that fit your buyer persona using TexAu.
Here’s a step-by-step tutorial to help you find all the additional data you need for LinkedIn cold outreach. By using this approach, your leads won’t be as “cold,” and you can expect amazing conversion rates.
Enhanced sales and marketing alignment

Data enrichment greatly contributes to enabling sales and marketing teams to work together more effectively toward shared company goals.
For one, data enrichment facilitates a seamless lead handoff process between sales and marketing teams. Enriched data offers plenty of useful context about leads, which can be leveraged by marketing teams to nurture leads effectively through targeted campaigns and personalized content after using effective B2B lead generation strategies.
When leads are ready to transition to the sales team, the enriched data ensures that sales professionals have a comprehensive understanding of the lead’s journey, allowing for a smooth continuation of the conversation and providing a tailored sales and customer experience.
Data-driven collaboration is another significant outcome of data enrichment for sales and marketing alignment. When analyzing enriched data points, both teams gain insights into the effectiveness of marketing campaigns, lead conversion rates, and customer behavior.
Moreover, data enrichment helps establish aligned goals and metrics. Sales and marketing teams can set shared KPIs and metrics that focus on revenue generation, customer acquisition, and customer satisfaction.
This alignment ensures that both teams are working towards common objectives and fosters a culture of collaboration and accountability.
Increased sales productivity
Data enrichment significantly boosts sales productivity by streamlining processes and enabling sales reps to focus on high-value activities. With enriched data, sales professionals can target prospects more effectively, personalize their sales engagement, and optimize their sales calls.
Enriched data helps identify high-potential prospects when using prospecting tools and refining prospecting efforts. This saves time and resources by avoiding low-conversion leads.
Additionally, enriched data allows for personalized engagement by helping sales reps understand their prospects’ preferences and pain points, resulting in stronger connections and increased engagement.
Streamlined account-based marketing

Account-based marketing, or ABM for short, is a strategic approach that focuses on targeting and engaging high-value accounts, and data enrichment plays a crucial role in its effectiveness.
Data enrichment enables sales and marketing teams to identify and select the most relevant target accounts for their ABM efforts. This focused approach ensures that resources and efforts are allocated to accounts with the highest potential for success.
Using enriched data also enables the creation of customized content and campaigns for targeted accounts. Because extra data helps determine the specific interests, preferences, and buying behaviors of the target accounts, teams are able to develop highly relevant and valuable content and campaigns that address their unique needs.
Better data on prospects and customers
Finally, continuous data enrichment provides sales experts with better data on prospects and customers, enabling comprehensive insights that drive more effective sales strategies and decision-making.
For one, firmographic and demographic data enrichment help teams understand the background and context of prospects and customers, allowing for highly targeted and tailored engagement.
In addition, enriched data provides an understanding of the behavior and engagement history of prospects and customers. It captures their interactions, preferences, and engagement patterns across various touchpoints, such as website visits, content downloads, and email interactions.
With this information, sales professionals can customize their approach, offer relevant solutions to prospects, and anticipate their needs, leading to more effective sales conversations.
Enrichment processes also often include using quality data verification and validation techniques. Eliminating outdated or incorrect information and validating the accuracy of the data means that sales can rely on high-quality information when making decisions and driving sales activities.
How to Use Data Enrichment in Your Sales Process

Now that we know the benefits of data enrichment and how it works, let’s take a closer look at how it can enhance your sales process and improve your outreach efforts.
First off, in order to effectively utilize data enrichment, consider implementing it at two levels:
- Company level enrichment: at the company level, data enrichment provides insights about specific companies or a list of companies you are targeting. Finding out about the technologies a company is using gives you an understanding of their infrastructure and potential struggles. Additionally, you can identify if a company is actively hiring, which could indicate growth and opportunities for your product or service.
- Person level enrichment: data enrichment at the person level allows you to gather additional information about specific individuals within your target companies. Finding social media links or email addresses gives you insights into a person’s professional background, interests, and communication preferences. This information can be used to craft personalized messages that increase the chances of engagement.
And here are the basic steps you need to take in order to successfully implement data enrichment in your sales strategy:
- Identify data gaps and needs specific to the sales process — you should first evaluate your current data volumes and identify areas where enrichment can add value. Determine the specific information you need to better understand your prospects and customers.
- Choose the right data enrichment provider — research and select a reliable data enrichment provider that offers the types of data relevant to your sales process.
- Ensure data quality and accuracy — before integrating enriched data into your sales process, verify its quality and accuracy. Perform regular data cleansing and validation to maintain the integrity of your database. Inaccurate or outdated information can hinder your sales efforts in the long run.
- Use Google Sheets for data management — Google Sheets is a versatile and user-friendly tool that many businesses use for managing enriched data. Once you create a Google Sheet for this purpose, you can import the enriched data directly into it, which would ensure a centralized and easily accessible data repository. Keep in mind that Google Sheets may not be the most optimal or efficient tool due to its limitations in scalability, data security, and advanced data manipulation capabilities.
- Integrate data enrichment into the sales process and CRM system — automate the enrichment process whenever possible to ensure real-time updates and save time for your sales team. Integrate enriched data into your CRM to provide sales reps with easy access to comprehensive prospect information. You can also integrate your CRM and LinkedIn using Expandi, which ensures that your sales team has the most up-to-date and relevant information available from LinkedIn on hand.
Tips for using enriched data effectively
- Segment your prospects. You can get the most use out of enriched data when segmenting your prospects based on relevant attributes. Proper segmentation allows you to prioritize your outreach efforts and tailor your messaging according to different customer segments. This increases response rates and customer engagement.
- Customize your value proposition. Another good idea is to use enriched data to align your value proposition with the prospect’s specific requirements. Highlight how your product or service can address their needs or improve their workflows based on the insights gained from data enrichment. Tailoring your value proposition to each prospect’s needs increases the impact of your offering.
- Use multiple communication channels. Take advantage of the enriched data to identify the preferred communication channels of your prospects. Whether it’s email, LinkedIn, phone calls, or social media platforms, choose the channels that are most likely to reach and engage your target audience. This multi-channel approach increases your chances of connecting with prospects and generating meaningful interactions.
- Continuously refresh your data. Enriched data is most effective when it is accurate and up to date. Data decay is a common issue, so you should regularly review and update your enriched data to ensure its relevance and reliability.
Reaching Out to Selected Contacts

Targeted outreach allows you to focus your efforts on the most relevant prospects, increasing your chances of sales engagement and conversion.
To use enriched data for message personalization:
- Grab the recipient’s attention by referencing a shared connection, recent news about their company, or a specific pain point they might be facing. Use the enriched data to demonstrate your knowledge and relevance from the very beginning.
- Clearly communicate the value your product or service brings to their specific situation. Emphasize how it aligns with their goals, addresses their challenges, or improves their current processes, leveraging the insights gained through data enrichment.
- Use case studies or success stories that resonate with the prospect’s industry, technology stack, or challenges. Demonstrating how your offering has delivered positive results to similar companies or individuals helps you establish credibility and relevance.
- Encourage the recipient to take a specific action, such as scheduling a call, attending a demo, or downloading a resource. Make the CTA personalized and compelling, aligning it with the prospect’s needs and interests.
Best practices for using LinkedIn and other channels for outreach

LinkedIn is a powerful platform for professional networking and outreach. When using LinkedIn or other channels for outreach, teams should always focus their efforts on customizing their connection requests.
This can be done by referencing a specific point of interest (e.g. a tool that the prospect is currently using as their solution of choice), after leveraging the data obtained through enrichment.
Here’s an example of an outreach sentence that incorporates behavioral data and the knowledge of the technology a prospect is using:
Hi [Prospect’s Name],
I hope this message finds you well. I recently came across your company and noticed that you are utilizing [specific technology]. As a [your role] in [your company], I wanted to reach out and share how our solution can complement and enhance your existing technology stack.
Our team has extensive experience working in the industry, and we have helped them leverage [specific technology] to achieve [specific outcomes or benefits]. Our solution has a proven track record of providing better insights and streamlining processes, ultimately driving greater efficiency and results.
I would love to schedule a brief call to discuss your current technology infrastructure and explore how our solution can address any challenges you may be facing. Please let me know a convenient time for you, or feel free to suggest an alternative if the proposed time doesn’t work.
Looking forward to connecting and sharing more about how we can support your business.
Apart from personalizing your approach, consider using multiple channels for outreach. Enriched data can help you understand which channels are most effective for specific prospects. For example, if you know a prospect is active on Twitter, you might choose to engage with them there in addition to LinkedIn.
Use automation tools to streamline outreach without sacrificing personalization
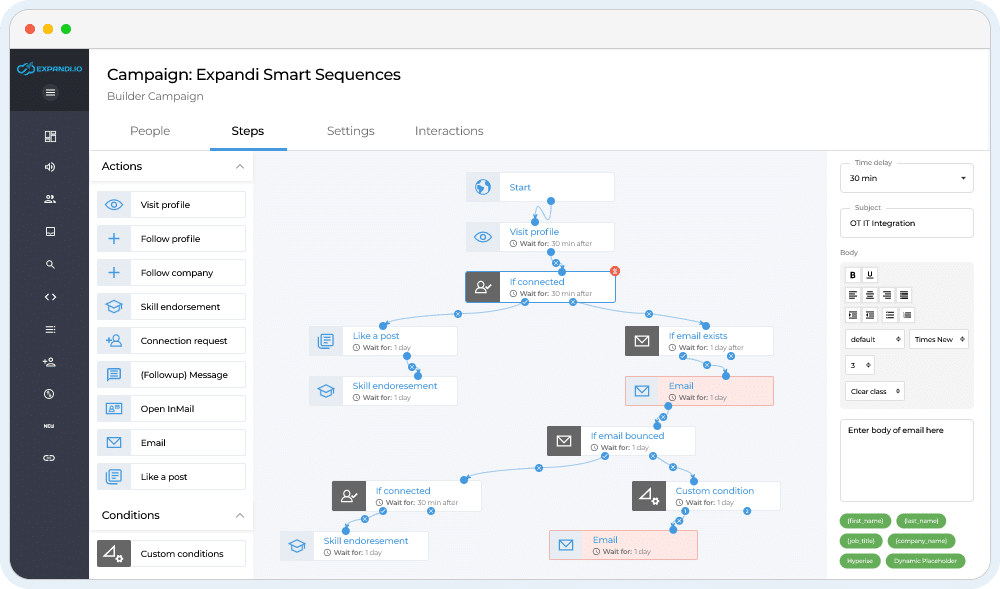
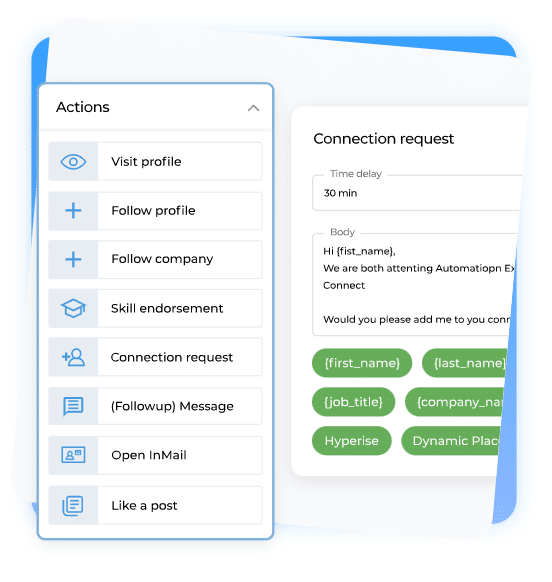
Automation tools can help streamline your outreach process while maintaining a personalized approach. Look for tools that allow you to customize and automate email templates, social media messages, and follow-up sequences.
Expandi is a powerful LinkedIn automation tool that truly revolutionizes sales and marketing efforts and ensures users stay ahead of the constant changes on the platform. With Expandi, users can leverage smart and automated sequences to scrape data from LinkedIn and contact prospects via the platform, enabling efficient and targeted communication.
One of the key benefits of Expandi is its ability to create personalized touch points for the audience. Its intelligent software allows users to easily tailor their messages, regardless of their background or platform usage.
Expandi’s image and GIF personalization feature adds a creative touch to outreach, increasing engagement by 2.2 times. Smart sequences enable personalized and omnichannel outreach, creating different outcomes based on the leads’ behavior.
To optimize your outreach efforts and leverage the impact of personalization, sign up for Expandi and start enjoying the benefits of automation.
Challenges and Pitfalls of Data Enrichment

Knowing how to avoid the challenges and pitfalls of data enrichment will help you maximize its benefits.
One common challenge would be that data enrichment relies on external data sources often, for which there is a possibility of inaccuracies or outdated information. That is why you should choose reputable data enrichment providers known for their reliability, and regularly validate and cleanse your enriched data to ensure data accuracy.
Another challenge that teams often come across is integrating enriched data into their existing sales process and CRM system. This can be complex, especially when dealing with large datasets, while poor integration can result in disjointed workflows, incomplete data, duplicate records, or data inconsistencies.
Again, a simple solution is to select the right kind of data enrichment tool and provider that offers seamless integration capabilities with your CRM system. Additionally, you should work to define clear data integration processes and establish data governance guidelines.
Showcasing specific correlations between sales deals won and enriched data requires access to detailed analytics and reporting within your CRM system. This level of analysis would typically involve integrating data from multiple sources, including enriched data, sales activities, and outcomes.
For example, with a CRM system like Pipedrive, you can use its reporting and analytics capabilities to understand how enriched data influences sales performance in different segments. This can provide insights into the effectiveness of your outbound strategies and the impact of enriched data on sales outcomes in specific segments.
Conclusion
Data enrichment has emerged as a valuable tool in the sales process with regard to data collection, empowering businesses to gain deeper insights, enhance prospect targeting, and personalize their outreach efforts.
Using enriched data at both the company and person levels can help improve lead generation, qualification, and overall sales productivity. However, it is also important to navigate the pitfalls associated with data enrichment to ensure its effectiveness.
As technology continues to advance and data becomes more abundant, harnessing the power of data enrichment will be increasingly relevant for businesses looking to stay ahead of the competition.
FAQ
What does data enrichment mean?
Data enrichment refers to the process of enhancing existing data with additional information from external sources to enrich data itself. It involves supplementing data to make it more comprehensive, accurate, and valuable.
Why is data enrichment important?
Data enrichment plays an important role in enhancing various aspects of business operations. It helps businesses gain a better understanding of their customers, target prospects more effectively, personalize marketing and sales efforts, and improve decision-making, ultimately leading to improved sales performance and customer satisfaction.
What are the steps in data enrichment?
The steps involved in data enrichment typically include:
- Data analysis: assessing existing internal data to identify gaps and determine the specific information needed for enrichment.
- Data source selection: choosing reliable external sources that provide the desired information relevant to the enrichment goals.
- Data integration: integrating enriched high quality data with the existing data set, either manually or through automated processes.
- Data validation: ensuring complete, quality, and accurate data through validation and verification processes.
- Data maintenance: regularly updating and maintaining the enriched data to ensure its relevance and reliability over time.
What is data enrichment in ETL?
In the context of Extract, Transform, Load processes, data enrichment refers to the transformation stage where additional relevant data is appended or enriched before loading it into the target system or database. Data enhancement in ETL helps improve the quality and usefulness of the collected data being processed and loaded into the target system for analysis, reporting, or other purposes.
You’ve made it all the way down here, take the final step
