The State of LinkedIn Outreach: Benchmarks Every GTM Leader Needs on Sequencing, Send Times, and AI vs. Human Messaging
Benchmark your LinkedIn outreach efforts in H2 2026 with Expandi’s original data from 13M+ connection requests and 6M+ outbound messages.
In H1, we published the first LinkedIn outreach benchmarks report using data from 70,130 Expandi campaigns.
The reception confirmed what we suspected: sales teams, SDR leaders, and lead generation agencies have been flying without instruments. No reliable benchmarks for connection acceptance. No data on what message length works. No way to tell whether 25% acceptance is strong for your industry or a sign you need to rebuild your targeting.
This edition goes wider and deeper. We analyzed 13.2 million connection requests and 6.7 million outbound messages across 13,302 active Expandi accounts, spanning May 2025 through April 2026.
We also ran a separate research track through Expandi’s database to answer the questions the H1 report couldn’t:
- Does posting on LinkedIn improve your outreach acceptance rate?
- Does AI-generated personalization outperform your own templates?
- Does it matter whether your leads come from Sales Navigator or a CSV import?
- What’s the right number of messages in a sequence?
Some of the findings reinforce what experienced outreach operators already know. Others challenge assumptions that have spread through the LinkedIn outreach space without data behind them.

What stands out to me the most is that LinkedIn outreach is becoming more mature. There are more tools, more AI, and more automation than ever, but the fundamentals still determine who wins. Better targeting, shorter messages, and thoughtful follow-up consistently outperform unnecessary complexity. Technology should help teams be more relevant and more human at scale and not to just send more. That’s where I believe the future of outbound is heading.
Inside this report:
- Platform-wide benchmarks from 13.2M connection requests
- Performance breakdowns by industry, seniority, and company size
- The impact of thought leadership on outreach acceptance
- What happened when we tested AI-personalized messages against human-written templates
- CSV imports vs. Sales Navigator lead sourcing
- Which opening lines get accepted and which message lengths get replies
- The ideal number of messages in a sequence (and when adding more hurts)
- Best time of day and day of week to send
- Monthly trends and what’s declining
Data sources:
- Primary dataset: 13,218,869 connection requests, 6,730,447 outbound messages, 3,766,161 accepted connections across 13,302 active Expandi accounts (May 2025–April 2026)
- Research dataset: Expandi shadow database research, 8 analysis tracks (2026 window, prepared June 2026)
- H1 2026 report: Referenced as prior benchmark where relevant (read the H1 report)
All findings are observational: they show association, not proof of causation. The methodology section at the bottom explains the measurement methods and their limitations.
Disclaimer
All data in this report is anonymized and aggregated. No individual user, account, campaign, or message is identifiable in any finding we publish. We do not read, store, or share the content of any user’s outreach messages.
The underlying data was pulled in bulk from Expandi’s platform analytics and analyzed at the cohort level: by industry vertical, sender seniority, company size, language, and campaign configuration. At no point did this research involve reviewing individual accounts or identifying specific users. The patterns we report reflect collective usage behavior across thousands of accounts, not the activity of any single team or organization.
Expandi takes user privacy seriously. Our analysis infrastructure operates on a read-only shadow database, separate from production systems, and all queries are scoped to return aggregate counts and rates — never individual records.
Key Takeaways
- Three messages is the campaign sweet spot. Campaigns with three messages reply at 9.8%. Five or more messages drops to 5.0%, worse than sending a single message. The second message is the most effective per recipient at 8.8%, making it the place to put your strongest pitch.
- Morning sends lift acceptance by 8–10 points. Connection requests sent between 7–11am accept at roughly 32%, compared to 24% in the evening. Day of week, by contrast, barely moves either metric.
- AI-personalized messages don’t outperform human-written templates — yet. When compared within the same accounts, AI hyperpersonalization drops acceptance by 12% and leaves reply rate flat. The apparent lift in cross-account comparisons is selection bias: stronger operators adopt AI, but their own templates still outperform it.
- Lead with an existing tie, keep it under 200 characters. Connection notes referencing a follow, a group, or a shared network accept at 1.8–2.7x the 30.2% baseline. Messages of 150–200 characters hit the peak reply rate at 8.5%.
LinkedIn platform-wide benchmarks
TL;DR:
28.5% of connection requests are accepted. 10.4% of outbound messages get a reply. 3.0% of connection-request notes get a response.

Those are the three numbers every outreach team should be benchmarking against, drawn from 13.2 million connection requests and 6.7 million messages.
The H1 report, based on a smaller 70K-campaign dataset, reported 29.61% acceptance and 10.3% message reply.
Both figures sit close to where they landed this time. External benchmarks fall in a similar range: Belkins reported 26.4% in its 2025 co-authored study (which included Expandi data alongside Reply.io and Nooks), and Cleverly cites 30–45% as the “healthy” 2026 range.
The platform average is useful as a sanity check, but it’s also the least interesting number in this report. Every cohort breakdown that follows shows wide variance behind it — by industry, by message type, by timing, and by sequence structure.
The better question isn’t “how does my team compare to 28.5%?” but “what’s the expected rate for my segment, and what levers actually move it?”
Who you target matters more than who you are
TL;DR:
Sender seniority fits inside a 3-point band (26.3%–29.4% acceptance). Company size barely moves the needle. Industry is the only demographic dimension with real spread.
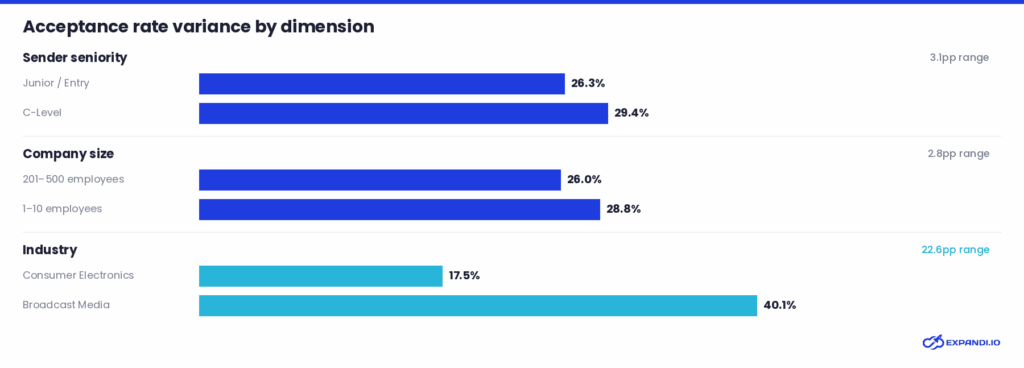
Across 13,302 senders, C-Level executives achieve 29.4% acceptance and Junior/Entry-level senders achieve 26.3%. That’s the full range. Message reply rates are similarly flat across seniority levels (9.6%–11.4%). A VP and an SDR reaching out to the same audience will see roughly the same acceptance rate.
Company size follows the same pattern: acceptance ranges from 26.0% (201–500 employees) to 28.8% (1–10 and 5,001–10,000 employees). The 2–3 point dip at mid-market companies isn’t large enough to change a campaign strategy.
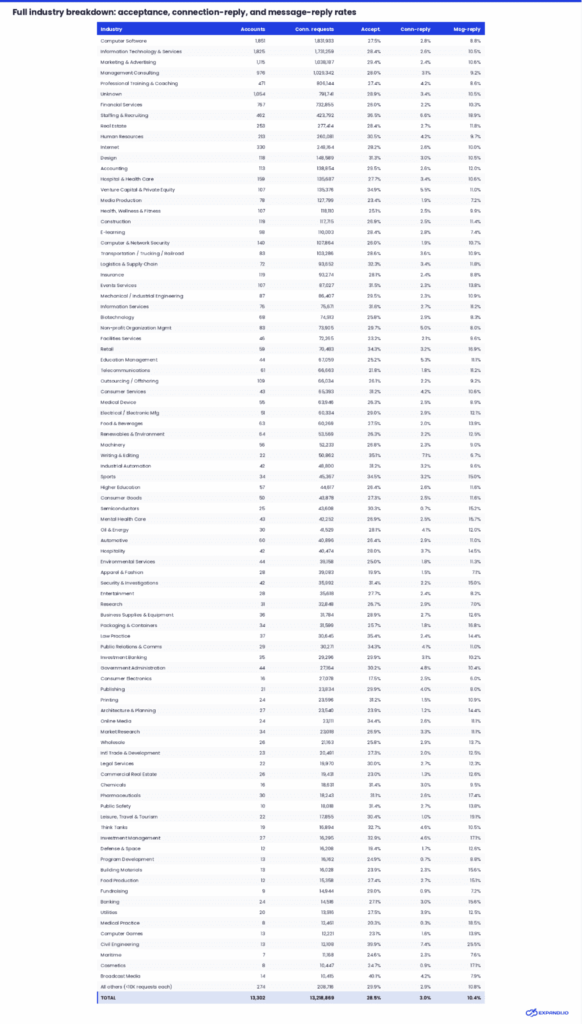
Industry is the one dimension where segmentation pays off. Acceptance rates range from 17.5% (Consumer Electronics) to 40.1% (Broadcast Media). Staffing & Recruiting leads on message reply rate at 18.9%, roughly 2x the platform average and 2x Computer Software’s 8.8%.
The Staffing & Recruiting outlier isn’t surprising if you consider how that industry uses LinkedIn: recruiting messages are reciprocal by nature. The recipient often needs what’s being offered. Vendor-to-buyer outreach in Software doesn’t have that structural advantage, which is why comparing your SaaS campaign’s reply rate to a platform average inflated by recruiters is a mistake.
The full industry table (60+ industries, all three rates) is in the appendix.
Does posting on LinkedIn improve your outreach acceptance rate?
TL;DR:
Accounts with 1,000+ followers and consistently engaged posts accept at 30–37%, compared to 27–29% across the platform. The sample is small and directional — but the mechanism is plausible.

We defined a “thought leader” account as one with at least 1,000 followers where every scraped post received more than 10 likes. At a credible floor of three or more posts on record, 38 accounts qualified — and they accepted connection requests at 30.5%, compared to the 27–29% platform average.
Removing the post-count floor and including single-post accounts pushes the rate to 36.6%, but that’s inflated by accounts where one post happened to perform well. The stricter reading is more honest.
This finding comes with certain limitations, as the sample is rather small.
But, what we can say is: the direction is consistent. Posting creates name recognition in a prospect’s feed before a connection request arrives. That recognition may lower the friction of accepting.
At worst, posting is a low-cost activity that correlates with slightly better outreach results. At best, it directly warms up your audience in a way that paid warmup sequences can’t replicate.
Unedited, AI-generated messages don’t outperform human-written messages (yet)
TL;DR:
When we compared AI-generated outreach against human-written messages from the same accounts, human copy won on acceptance by 12%. Reply rate was flat.
There’s a widespread assumption in outbound right now that AI-generated messages — tailored per recipient using profile data — should outperform static templates. We tested that assumption against Expandi’s own data.
Across 118 campaigns from 73 accounts (October 2025 through June 2026), the surface-level comparison between AI-generated and non-AI campaigns looks promising:
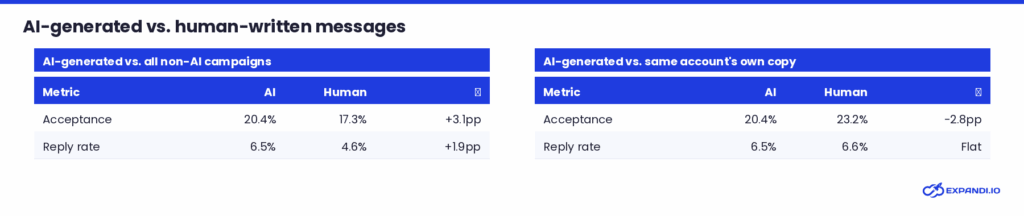
AI campaigns achieved 20.4% acceptance and 6.5% reply rate, versus 17.3% acceptance and 4.6% reply from the broader non-AI population. That’s an apparent 18% acceptance lift.
But that comparison is misleading. It compares AI-using accounts against everyone else — and the accounts that use AI tend to be stronger operators across the board. Their non-AI campaigns already outperform the platform average.
When we ran a within-account analysis (comparing each account’s AI-generated campaigns against that same account’s human-written campaigns) the picture reversed:
Human-written messages outperformed AI-generated ones on acceptance by about 12%. Reply rate was effectively identical.
There are several plausible explanations.
AI-generated copy may read as personalized to the sender but feel formulaic to recipients who’ve encountered the pattern before. Users may also be deploying AI on their hardest, coldest audiences, where list quality is weaker to begin with. And AI-generated campaigns in this dataset are newer, so late-arriving acceptances may not have fully accumulated.
The takeaway isn’t that AI has no role in outreach. It does, as a drafting tool. Use AI to generate a starting point, then rewrite with your own knowledge of the prospect’s situation, industry, and pain points.
The accounts that perform best on Expandi aren’t the ones automating message creation entirely. They’re the ones investing in message quality, using AI to move faster without handing over the final word.
CSV imports vs. Sales Navigator: the source barely moves the needle
TL;DR:
Sales Navigator edges acceptance by 1.3 percentage points. Reply rate is a dead heat.

We restricted this analysis to campaigns fed by a single lead source — either CSV imports or Sales Navigator searches — for clean attribution. Across nearly 11,000 campaigns and 2.2 million contacted prospects.
Sales Navigator’s built-in targeting filters produce a marginally more receptive audience (19.8% vs 18.5%). But “marginally” is the operative word. On reply rate, the metric that actually measures conversation starts, the two sources perform identically.
This challenges a common assumption in sales teams: that upgrading to Sales Navigator or investing more time in its filters will materially improve campaign outcomes.
The data says the improvement exists, but it’s worth about one additional acceptance per 77 connection requests. The choice between CSV and Sales Navigator should be driven by cost, workflow integration, and list availability — not by an expectation of meaningfully better conversion.
What the highest-performing connection messages have in common
TL;DR:
The top connection notes reference an existing relationship or shared context. The top-performing messages are 150–200 characters long.
We split this into two separate analyses with different metrics, because opening lines and message length influence different outcomes.
Connection notes affect whether someone accepts. Post-connection messages affect whether they reply. Conflating the two produces misleading conclusions.
Opening lines that get accepted
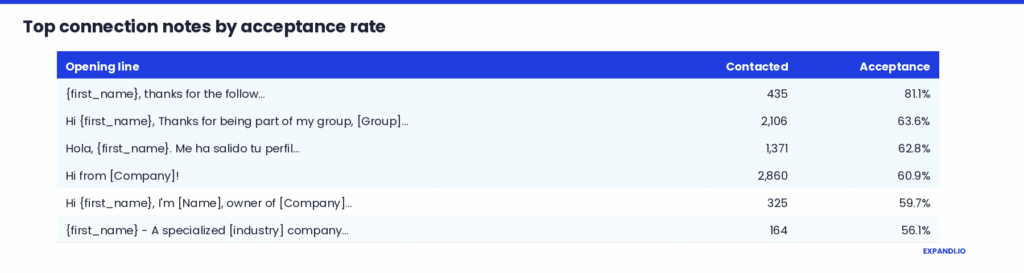
We isolated single-connection-request campaigns (no other outreach actions, so acceptance can be cleanly attributed to the note). Among 240 qualifying campaigns with at least 50 contacts each, the baseline acceptance rate was 30.2%.
The top performers run 1.8–2.7x that baseline:
| Opening line | Contacted | Acceptance |
|---|---|---|
| Hey {first_name}, thanks for the follow. It’s great to connect with you… | 435 | 81.1% |
| Hi {first_name}, Thanks for joining my group, … | 2,106 | 63.6% |
| Hola, {first_name}. Me ha gustado tu perfil, sobre todo… | 1,371 | 62.8% |
| Hello from [Company Name]! | 2,860 | 60.9% |
The pattern that separates these from average-performing notes isn’t length or tone, but the presence of an existing tie.
“Thanks for the follow,” “thanks for joining my group,” and a shared network reference all frame the connection as a continuation rather than a cold introduction. Accepting feels like acknowledging someone you already know, not opening a door to a stranger.
The second pattern is brevity with low friction. “Hello from [Company Name]!” hit 60.9% on 2,860 contacts with essentially zero ask. No pitch, no explanation, no positioning statement.
The third: language match. Spanish, Japanese, German, and Danish openers all appear in the top 10. Writing in the recipient’s language is an immediate signal that the message was written for them.
Remember: these are patterns, not scripts. Every top-performing message is tied to one sender’s audience, industry, and context. A “thanks for the follow” note doesn’t work if the recipient didn’t follow you.
Message length that gets replies
Separately, we looked at single-message campaigns (one message, no other outreach actions) to measure reply rate by character count. The baseline was 6.8% across 458 qualifying campaigns.
| Length (chars) | Campaigns | Contacted | Reply rate |
|---|---|---|---|
| 1–50 | 9 | 4,113 | 15.7% |
| 51–100 | 60 | 20,453 | 5.1% |
| 101–150 | 60 | 29,964 | 6.3% |
| 151–200 | 57 | 30,121 | 8.5% |
| 201–300 | 116 | 27,341 | 5.9% |
| 301–500 | 59 | 19,495 | 7.6% |
| 500+ | 97 | 22,430 | 5.8% |
The most robust peak is 151–200 characters (8.5%), backed by 57 campaigns and roughly 30,000 contacts. That’s about two short sentences.
The 15.7% at 1–50 characters rests on only 9 campaigns — too thin to treat as a reliable trend. And unlike what you might expect, longer messages don’t dramatically underperform: 301–500 characters still reply at 7.6%, above the baseline.
The “keep it short” advice is directionally correct, but length alone is a weak lever. One clear ask or one specific value reference matters more than hitting an exact character count.
Three messages is the sweet spot, five or more backfires
TL;DR:
Campaigns with three messages reply at 9.8%. Campaigns with five or more drop to 5.0% — below even a single message.
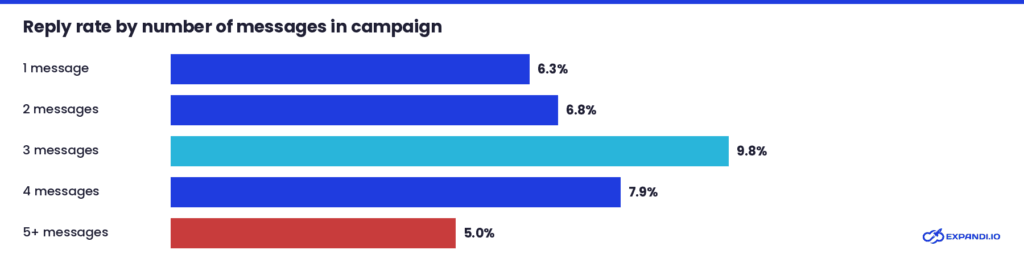
How many messages should a sequence have?
Across 2,966 campaigns with at least 50 contacts each:
| Messages in campaign | Campaigns | Contacted | Reply rate |
|---|---|---|---|
| 1 | 619 | 203,520 | 6.3% |
| 2 | 412 | 134,879 | 6.8% |
| 3 | 784 | 277,395 | 9.8% |
| 4 | 429 | 122,567 | 7.9% |
| 5+ | 722 | 208,336 | 5.0% |
One or two messages leave replies on the table. Three is where the lift appears. After four, response rate declines, and five-plus messages actually perform worse than sending a single message.
The 5+ finding deserves emphasis: more messages don’t just produce diminishing returns — they actively hurt.
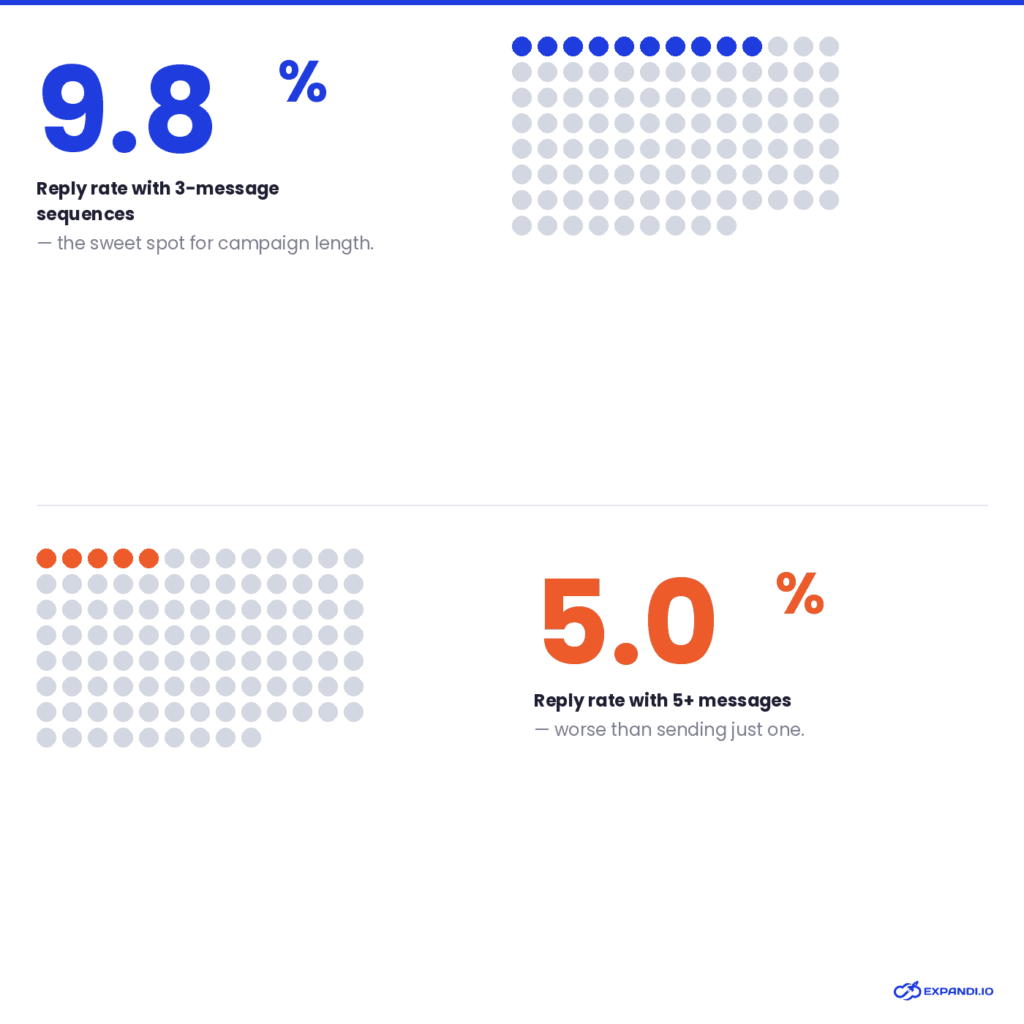
Possible explanations include prospect fatigue (a fifth unreplied message reads as spam) and self-selection (campaigns that need five touchpoints may be targeting less receptive audiences).
Either way, the data is clear about the shape.
Which message position is most effective?
Per-send reply rate (measuring how many recipients of each specific message replied to that message) adds a different angle:
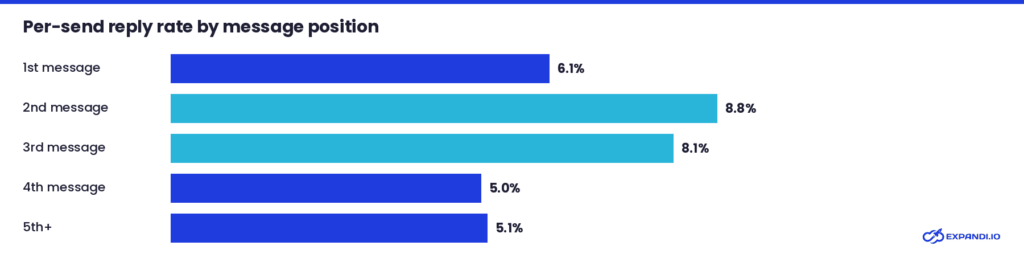
The first message is not the most effective per recipient. In connector campaigns, message 1 is the connection-request note — and recipients can’t reply until they accept. The second and third messages are post-connection: the prospect has already decided to let you in, and these messages land in a context where replying is frictionless.
That structural advantage explains the 2nd message’s 8.8%.
The combined read: the opening message collects the most raw replies because everyone receives it, but the 2nd and 3rd messages convert at a higher rate per person reached. Build campaigns around three messages.
Put real effort into your connection note (it determines the funnel entry), then write your strongest pitch for message 2.
When to send: morning lifts acceptance by 10 points over evening
TL;DR:
Connection requests sent between 7–11am accept at 32–37%. Evening sends accept at 23–24%. Day of week barely matters for either metric.
We sampled roughly 36,500 sent messages and 17,900 connection-request sends from January through mid-May 2026 to measure outcomes by send time. Times are Amsterdam local (Expandi’s default server timezone).
Time of day
The clearest finding: connection-request acceptance follows a morning gradient. Requests sent between 6–11am accept at approximately 32%, declining to roughly 24% by evening. That’s an 8–10 point gap — significant enough to build into campaign scheduling.
Reply rate, by contrast, is flat across the day. When someone responds to your message doesn’t depend meaningfully on when you sent it.

The overnight window (midnight–5am) shows a noisy 11% reply rate and ~25% acceptance, but the send volumes are tiny. Don’t schedule campaigns based on overnight noise.
Day of week
Reply rate stays in an 8.3–9.1% band across the week. Acceptance sits between 26.5% and 30.4%. Monday is marginally best for replies (9.1%), Saturday edges ahead on acceptance (30.4%), but neither gap is large enough to warrant rescheduling campaigns around.
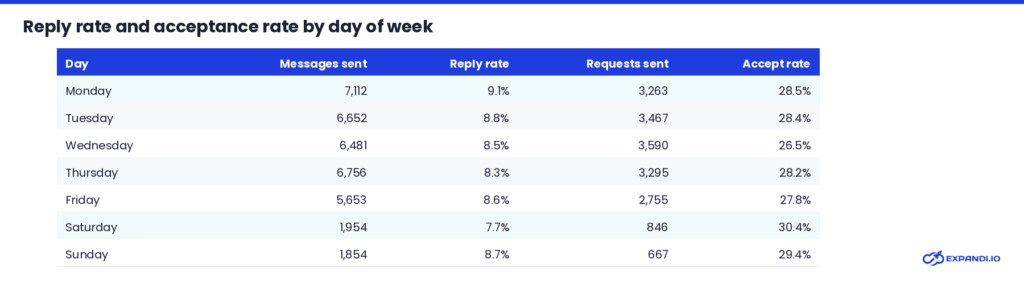
The practical recommendation: schedule connection requests for morning delivery. Don’t over-optimize the day.
Monthly trends
Connection-request reply rate dropped from 3.5% in May 2025 to 2.2% in April 2026, a 37% relative decline over the year. The H1 report flagged January as the worst month (21.45% connection approval, 6.47% reply rate) and also the highest-volume month (10,651+ campaigns launched).

The declining connection-request reply rate doesn’t mean outreach is getting less effective — it means recipients are increasingly accepting connections without responding to the note. They accept silently and move on.
This reinforces the importance of investing in your post-connection welcome message and follow-up sequence, rather than relying on the connection note itself to start a conversation.
What now? Best practices to implement after reading this data
Every recommendation below traces to a specific finding in this report:
1. Build three-message sequences
Three messages is the sweet spot at 9.8% reply rate. Adding a fourth drops you to 7.9%. Five or more drops below a single message. In Expandi’s Campaign Builder, you can lay out the full flow — connection request, post-connection message, follow-up — in one visual sequence with conditions between steps. If you’re running sequences longer than four messages, test a trimmed version against your current flow and compare reply rates in the campaign stats.
2. Warm up before you connect
The top-performing connection notes reference an existing tie: a follow, a group membership, a shared network. If that tie doesn’t exist yet, create it. Expandi’s Smart Sequences let you automate pre-connection touchpoints — viewing a prospect’s profile, liking a post, following their company page — so your name shows up in their notifications before the connection request lands. The H1 report found Builder Campaigns (which combine warmup steps with outreach) achieved a 22% connection approval rate and 7.22% reply rate, outperforming cold-only approaches.
3. Send connection requests in the morning
Requests sent 7–11am accept at ~32%, compared to ~24% in the evening. In Expandi, you set daily sending windows per campaign in your account settings. Shift your connector campaigns to morning delivery and leave the afternoon for follow-up messages (where timing doesn’t move the needle as much).
4. Write your strongest pitch for message 2, not message 1.
The second message in a sequence converts at 8.8% per send, the highest of any position. Your connection note gets you in the door; your second message starts the conversation. In the Campaign Builder, treat step 2 as the main event: reference something specific about the prospect, share a relevant resource, or ask a question tied to a pain point they’ve posted about.
5. Keep messages around 150–200 characters
The peak reply rate sits in that range (8.5%), but length is a weak lever compared to having one clear ask. Two short sentences — who you are, what you’re offering or asking — tends to outperform longer pitches that try to cover everything upfront.
6. Use AI to draft, then edit
AI-hyperpersonalized campaigns underperform the same accounts’ own templates by 12% on acceptance. That doesn’t mean AI is useless — it means the output needs editing. Use Expandi’s AI message generation to get a starting draft, then rewrite with your own knowledge of the prospect’s situation. The accounts that perform best on the platform are the ones investing in message quality, not automating it away entirely.
7. Post before you prospect
Thought-leader accounts outperform the platform average by 3–8 percentage points on acceptance. The mechanism is straightforward: prospects who’ve already seen your name in their feed are more likely to accept a connection request from you. Pair this with Smart Sequences warmup actions — your content builds recognition passively, while automated profile views and post likes create the active touchpoints.
8. Share what works across your team
Once you find a sequence that outperforms, don’t let it live in one rep’s account. Expandi’s shareable campaign templates let you replicate a winning flow across team members or client accounts without rebuilding the logic from scratch. The 30+ Marketplace templates are a starting point, but the real value is in building your own from campaigns that have proven results in your segment.
Methodology
This report draws on two data sources with different scopes and measurement methods. Rates produced by different methods are not directly comparable in absolute terms — the patterns and relative differences are what matter.
Primary dataset (Sections 1, 2, seasonality): 13,218,869 connection requests, 6,730,447 outbound messages, and 3,766,161 accepted connections across 13,302 active Expandi accounts, May 2025 through April 2026.
Research dataset (Sections 3–8): Analysis run against Expandi’s shadow database (Postgres, read-only), restricted to 2026 unless noted.
“Clean” campaign populations (opening lines, message length, sequence analysis): Restricted to campaigns created in 2026, with no deleted actions.
Send-time analysis: Sample-based (8 random 0.05% samples from 287M chatmessage rows, pooled). Times are Amsterdam local.
What this data can’t tell you: Connection degree at outreach time (not stored reliably), posting frequency (publish dates are empty; only scrape dates exist), and the causal effect of any single variable. These are associations, not experiments.
Benchmark your own outreach with Expandi
These numbers come from Expandi’s platform — the same campaigns, sequences, and automation tools you’d be using.
Start a 7-day free trial, run your first connector campaign, and see where your acceptance and reply rates land against the segment data in this report. The benchmarks are here. Now you have something to measure against.
FAQs about LinkedIn outreach in 2026
FAQs about LinkedIn outreach in 2026
28.5%, based on 13.2 million connection requests sent through Expandi between May 2025 and April 2026. External benchmarks sit in a similar range: Belkins reported 26.4% in 2025, and Cleverly cites 30–45% as the “healthy” 2026 range.
In our data, AI-hyperpersonalized campaigns performed 12% worse on acceptance than the same accounts’ own human-written templates. Reply rate was flat. The feature is still new (launched late 2025), but today, human-written messages outperform on Expandi’s platform.
Morning. Connection requests sent between 7–11am (Amsterdam time) accept at approximately 32–37%, compared to 23–24% in the evening. Day of week has minimal impact.
Three total messages is the sweet spot (9.8% reply rate). One or two messages leave replies on the table. Five or more messages drop below a single message’s performance (5.0%).
Marginally. Sales Navigator leads accept at 19.8% vs. 18.5% for CSV imports. Reply rate is identical. The difference is too small to justify a tool switch on conversion grounds alone.
151–200 characters (about two short sentences) replies at 8.5%, the highest of any length bracket with reliable volume. Longer messages don’t dramatically underperform — 301–500 characters still replies at 7.6%.
Appendix: Average LinkedIn acceptance rates across industries
Full data across all industries with meaningful sample sizes: acceptance connection-reply, and message-reply data. Industries with fewer than 10,000 connection requests in the period are aggregated into “All others”.