Lead Generation KPIs: 18 Metrics to Track, How to Calculate Them, and What “Good” Looks Like in 2026

Key Takeaways
- The lead generation metrics closest to revenue sit across four stages: engagement, conversion, efficiency, and velocity.
- Expandi’s platform averages are 28.5% connection acceptance and 10.4% message reply, but industry shifts acceptance from 17.5% to 40.1%.
- Positive reply rate and cost per held meeting are more valuable than raw lead volume or email opens.
- Review engagement weekly, unit economics monthly, and full-funnel returns quarterly.
Lead Generation KPIs: 18 Metrics to Track, How to Calculate Them, and What “Good” Looks Like in 2026


A dashboard can show hundreds of activity numbers and still leave one question unanswered: is outbound producing pipeline? The lead generation KPIs in this guide trace the answer from first connection to revenue.
Track one or two at each stage, compare outreach with the right segment, and use platform averages as a check rather than a target. Below are 18 formulas and current LinkedIn benchmarks, followed by a reporting cadence your team can adopt this week.
The 18 lead generation KPIs at a glance
| # | KPI | Stage | Formula | Review |
|---|---|---|---|---|
| 1 | Connection acceptance rate | Engagement | Accepted requests / requests sent x 100 | Weekly |
| 2 | Message reply rate | Engagement | Replied messages / messages sent x 100 | Weekly |
| 3 | Positive reply rate | Engagement | Interested replies / total replies x 100 | Weekly |
| 4 | Connection-note reply rate | Engagement | Note replies / connection requests with a note x 100 | Weekly |
| 5 | Email bounce rate | Engagement | Bounced emails / emails sent x 100 | Weekly |
| 6 | Reply-to-meeting rate | Conversion | Meetings booked / positive replies x 100 | Weekly |
| 7 | Meeting show rate | Conversion | Meetings held / meetings booked x 100 | Monthly |
| 8 | Lead-to-opportunity rate | Conversion | Qualified opportunities / leads x 100 | Monthly |
| 9 | Opportunity win rate | Conversion | Closed-won / closed opportunities x 100 | Quarterly |
| 10 | Lead-to-customer rate | Conversion | New customers / leads x 100 | Quarterly |
| 11 | Cost per lead | Efficiency | Channel or campaign cost / leads generated | Monthly |
| 12 | Cost per meeting | Efficiency | Channel or campaign cost / meetings held | Monthly |
| 13 | Customer acquisition cost | Efficiency | Sales and marketing costs / new customers | Quarterly |
| 14 | LTV:CAC ratio | Efficiency | Customer lifetime value / CAC | Quarterly |
| 15 | Pipeline generated | Efficiency | Sum of sourced opportunity value | Monthly |
| 16 | ROI | Efficiency | (Attributed revenue – cost) / cost x 100 | Quarterly |
| 17 | Lead velocity rate | Velocity | (Qualified leads this month – last month) / last month x 100 | Monthly |
| 18 | Speed to signal | Velocity | First-touch timestamp – signal timestamp | Weekly |
What are lead generation KPIs?
Lead generation KPIs are the measurements a sales team uses to judge if prospecting is creating qualified pipeline at an acceptable cost. A metric records activity, and a KPI is tied to a target and a decision.
Leading indicators can help you identify weaknesses in your funnel early, such as acceptance rates, reply rates, and speed to signal.
Lagging indicators such as win rate, CAC, and ROI confirm the commercial result after enough leads have moved through the outbound lead generation process.
You need both indicators but they belong to different reporting cadences.
Engagement KPIs: is your outreach landing?
1. Connection acceptance rate
Connection acceptance rate shows how often LinkedIn prospects accept your connection requests.
Formula: Connection acceptance rate = accepted requests / requests sent x 100
Expandi’s LinkedIn outreach benchmarks for 2026 put the platform average at 28.5%. Industry results range from 17.5% to 40.1%, so compare similar audiences. If acceptance is low, inspect list quality and your ICP versus buyer persona before testing connection request templates. Also, test morning sends: 7 to 11 a.m. requests accepted at about 32%, against about 24% in the evening.
2. Message reply rate
Message reply rate measures the share of outbound messages that received a reply.
Formula: Message reply rate = replied messages / messages sent x 100
The 2026 Expandi average is 10.4%. Count every reply here, then use positive reply rate to judge quality. If replies are low, inspect the audience and sequence. Three-message campaigns averaged 9.8% reply, whereas campaigns with five or more averaged 5.0%. Short, specific LinkedIn sales messages also give prospects an easier question to answer.
As Hester Noorman-van Schaik, Managing Business Partner at Expandi, puts it:
“From my experience, crafting a strong initial message can set the stage for success, giving you an immediate boost in engagement.”
3. Positive reply rate
Positive reply rate separates buying interest from objections, opt-outs, and neutral responses.
Formula: Positive reply rate = interested replies / total replies x 100
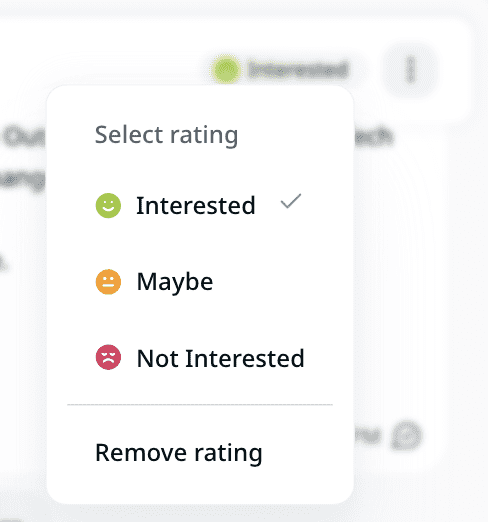
There is no universal benchmark because teams classify intent differently. Write the definition first. Expandi’s sentiment analysis classifies replies as Interested, Maybe interested, or Not interested, and the rating can be corrected in the Global Inbox. If total replies are healthy, but positive replies are low, review the audience and offer.
Measurement rule: Keep explicit opt-outs out of the numerator. A high total reply rate can hide weak commercial interest.
4. Connection-note reply rate
Connection-note reply rate tracks direct responses to the note attached to a LinkedIn request.
Formula: Connection-note reply rate = replies to notes / requests sent with a note x 100
The Expandi platform average is 3.0%. Treat it as one diagnostic input. The rate fell from 3.5% to 2.2% between May 2025 and April 2026 as more people accepted without replying. Judge the post-connection message separately.
5. Email bounce rate
Email bounce rate is the share of campaign emails that could not be delivered.
Formula: Email bounce rate = bounced emails / emails sent x 100
Split hard bounces from temporary failures if your provider supports it. A rising rate usually points to invalid addresses or a list-source problem. Expandi reports email separately from LinkedIn KPIs and supports bounce events through webhooks for your outreach tracking workflow.
Conversion KPIs: are replies turning into pipeline?
Replies only earn their place on a revenue dashboard when they move into qualified sales conversations. These five KPIs show where that handoff breaks.
6. Reply-to-meeting rate
Reply-to-meeting rate measures how often positive replies become booked meetings.
Formula: Reply-to-meeting rate = meetings booked / positive replies x 100
Use positive replies as the denominator and exclude all other replies. Set separate baselines by audience and offer, then account for the type of meeting you’re asking for. If the rate drops, inspect what happens between the prospect’s reply and the booking. Long forms and slow handoffs can lose an interested lead, and so can asking for too much, too soon.
7. Meeting show rate
Meeting show rate tells you how many booked meetings took place.
Formula: Meeting show rate = meetings held / meetings booked x 100
Report held meetings, cancellations, and no-shows separately. A weak show rate can signal poor qualification or too much time before the call. Check reminders and the promise that earned the meeting. A useful working session shouldn’t turn into a generic sales demo.
8. Lead-to-opportunity rate
Lead-to-opportunity rate measures the share of leads that sales accepts as qualified opportunities.
Formula: Lead-to-opportunity rate = qualified opportunities created / leads generated x 100
Sales and marketing must agree on what counts as a lead and what opens an opportunity. Write the rule in the CRM. If this rate is low, audit how you qualify B2B leads before asking for more volume. A definition change can move the rate without changing campaign quality, so annotate it.
9. Opportunity win rate
Opportunity win rate shows how often opportunities with a final outcome close as customers.
Formula: Opportunity win rate = closed-won opportunities / closed opportunities x 100
Use a mature cohort and exclude open opportunities. Segment by source and customer profile so strong inbound does not mask weak outbound. If LinkedIn-sourced opportunities reach the pipeline but rarely win, inspect qualification and positioning. The problem sits later in the LinkedIn sales pipeline.
10. Lead-to-customer conversion rate
Lead-to-customer conversion rate measures the share of sourced leads that become paying customers.
Formula: Lead-to-customer rate = new customers / leads generated x 100
This metric arrives late in the process. Compare leads and customers from the same acquisition cohort instead of dividing this month’s customers by this month’s leads. For long sales cycles, show how much of the newer cohort remains open.
Efficiency KPIs: is lead generation worth the spend?
Efficiency metrics show what your outreach costs and how much pipeline or revenue it produces. Use the same cost definitions across channels or the comparison holds up.
11. Cost per lead
Cost per lead (CPL) is the average amount spent to generate one lead.
Formula: Cost per lead = channel or campaign cost / leads generated
Include costs your team can assign consistently, such as tools, data, and outsourced work. State your lead definition beside the number. Keep in mind, a cheap unqualified contact proves little about efficiency. Compare CPL with lead-to-opportunity rate and see how much lead generation costs.
12. Cost per meeting
Cost per meeting is the campaign cost required to produce one held sales meeting.
Formula: Cost per meeting = channel or campaign cost / meetings held
For outbound teams, this can be more useful than CPL because it prices an outcome sales can act on. Use held meetings, as bookings understate the cost when no-shows are high. Calculate it separately for each campaign and audience segment. Supporting KPIs will show if a rise comes from reach, replies, qualification, or attendance.
13. Customer acquisition cost
Customer acquisition cost (CAC) is the average sales and marketing cost required to successfully bring in a new customer.
Formula: CAC = sales and marketing costs / new customers acquired
CAC is wider than campaign spend. Include sales and marketing costs used to acquire the cohort, then align the periods. Don’t compare fully loaded CAC for one channel with media spend alone for another. Long sales cycles need a cohort or rolling view.
14. LTV:CAC ratio
LTV:CAC ratio compares expected customer lifetime value with the cost of successfully bringing in that customer.
Formula: LTV:CAC ratio = customer lifetime value / customer acquisition cost
Stripe notes that SaaS businesses often use 3:1 as a healthy convention. Handle it as a starting point, because gross margin, payback time, churn, and cash constraints change the target. A very high ratio can indicate you’re underinvesting in acquisition.
15. Pipeline generated
Pipeline generated is the total value of qualified opportunities sourced by a channel during the reporting period.
Formula: Pipeline generated = sum of sourced opportunity value
Separate sourced from influenced pipeline. Give each opportunity one sourcing rule and record the campaign. Keep pipeline separate from revenue and show it beside win rate. Expandi CRM activity can preserve campaign history after a qualified lead is synced.
16. Return on investment
Return on investment (ROI) compares attributed revenue with the cost that produced it.
Formula: ROI = (attributed revenue – cost) / cost x 100
Use realized revenue for closed-loop ROI. Label projected revenue or pipeline as forecast ROI. Apply one attribution model across channels and disclose how multi-touch deals are assigned. If ROI is low, check payback timing and the funnel stage where losses appear.
Velocity KPIs: how fast is the pipeline moving?
Velocity KPIs track growth in qualified lead volume and the time it takes to act on buyer intent. They can reveal a slowdown before it appears in revenue.
17. Lead velocity rate
Lead velocity rate (LVR) shows month-over-month growth in qualified lead volume.
Formula: LVR = (qualified leads this month – qualified leads last month) / qualified leads last month x 100
LVR is useful for planning because it moves earlier than revenue. It has no universal healthy benchmark, so set the target from capacity and growth plans.
Use the same qualification rule each month. If the previous month had zero qualified leads, report the absolute increase instead of a percentage. Pair LVR with cost per meeting so faster growth doesn’t hide declining efficiency.
18. Speed to signal
Speed to signal measures the time from a buying signal to the first relevant outreach touch.
Formula: Speed to signal = first-touch timestamp – signal timestamp
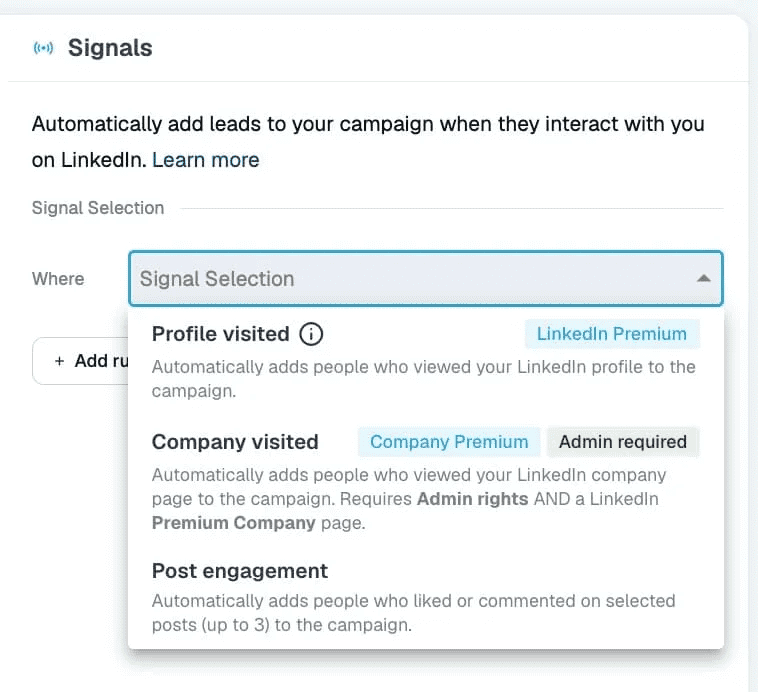
Profile visits, company-page visits, and post engagement can reveal timely interest. Expandi’s H1 2026 report found 13.4% reply for profile-visitor campaigns and 14.21% for event campaigns, against a 10.3% platform average. Those are observational results, but they show why timing deserves its own KPI.
Expandi Signals adds new matches to campaigns about every 24 hours. Use that sync cycle when setting your speed-to-signal target. The 2025 6sense buyer study adds context: buyers first contacted sellers at 61% of the journey, down from 69% in 2024.
Lead generation metrics that can mislead you
Some numbers are useful diagnostics but should not be relied on to optimise outreach campaigns and funnels.
1. Email open rates
Apple’s Mail Privacy Protection prevents senders from seeing if a protected user opened an email. Automated image loading and privacy controls can distort opens. Judge cold email by delivery, replies, qualified interest, and meetings.
2. Connection-note replies on their own
A falling note-reply rate is inconclusive on its own. Expandi’s decline from 3.5% to 2.2% came as more people accepted silently. Check acceptance and post-connection replies before changing the campaign.
3. Platform averages
The 28.5% acceptance average hides an industry span from 17.5% to 40.1%. Sender seniority stayed inside a 26.3% to 29.4% band, and company size barely shifted acceptance. Start with industry.
4. Before-and-after or cross-account comparisons
Expandi’s State of LinkedIn Outreach H2 2026 found an apparent 18% acceptance lift for AI-generated outreach across accounts. Inside the same accounts, human-written campaigns led by about 12% on acceptance, with flat reply rates. Compare like with like and treat AI lead generation software as one variable.
Methodology note: Expandi’s H2 2026 findings come from anonymized, aggregated observations of 13,218,869 connection requests and 6,730,447 messages across 13,302 active accounts from May 2025 through April 2026. The findings show associations, but can’t establish causation.
How to set lead generation KPI targets by industry
Start with a comparable audience, then establish your own baseline. A platform average can show when a result is unusually high or low. Set the target from your segment, which keeps a software team from chasing a recruiting benchmark.
| Audience or dataset | Current benchmark | How to use it |
|---|---|---|
| Expandi platform, May 2025 – April 2026 | 28.5% acceptance; 10.4% message reply | Sanity check |
| Consumer Electronics | 17.5% acceptance | Low end of Expandi’s industry range |
| Broadcast Media | 40.1% acceptance | High end of Expandi’s industry range |
| Staffing and Recruiting | 18.9% message reply | Recruitment-specific comparison |
| Computer Software | 8.8% message reply | Software-specific comparison |
| Belkins/Expandi 2025 dataset | 25.3% acceptance with a note; 27.6% without | External cross-check with different methodology |
How to calculate your lead generation targets using industry benchmarks
This example uses Expandi’s platform averages for the first 2 steps. Every downstream rate is an illustrative input supplied for the calculation.
| Step | Calculation | Illustrative result |
|---|---|---|
| Connection requests | Starting volume | 1,000 |
| Accepted connections | 1,000 x 28.5% | 285 |
| Replies | 285 x 10.4% | 29.64 |
| Positive replies | 29.64 x 40% | 11.86 |
| Meetings booked | 11.86 x 50% | 5.93 |
| Meetings held | 5.93 x 80% | 4.74 |
| Cost per held meeting | $1,500 / 4.74 | About $316 |
Replace the 40%, 50%, 80%, and cost inputs with your own numbers. This makes the effect of each stage visible. Raising acceptance alone does little if positive replies or show rate stay weak.
How to build a lead generation KPI dashboard
Use two operating views: a weekly team dashboard for fast feedback and a monthly leadership view for pipeline and cost. Add a quarterly review for metrics that need mature cohorts.
| Cadence | KPIs to Include | Decision |
|---|---|---|
| Weekly | Acceptance, reply, positive reply, meetings booked, speed to signal | Adjust targeting, copy, follow-up, or handoff |
| Monthly | Show rate, lead-to-opportunity, CPL, cost per meeting, pipeline generated | Reallocate effort and budget |
| Quarterly | Win rate, lead-to-customer, CAC, LTV:CAC, ROI | Judge channel economics and growth capacity |
Expandi campaign statistics and Workspace Analytics cover connection, messaging, per-step, and account-level performance. Workspace KPIs use cached data through the previous day, so same-day sends are too early to judge. The Global Inbox combines replies with conversation-status filters and sentiment review.
For downstream reporting, Expandi’s HubSpot, Pipedrive, and Salesforce integrations can sync qualified contacts automatically or manually. After a contact is synced, later connection requests, accepted requests, messages, and replies are logged as CRM activity. Add opportunity stage and revenue in the CRM, then join finance costs for CAC and ROI. Shared Campaigns help a team run one sequence across several LinkedIn accounts and track progress in one place.
Keep the dashboard compact. Every KPI needs an owner, definition, cohort, and decision. If nobody acts when it moves, leave it out of the executive view.
Case Study: UltB’s meetings-per-week KPI
UltB used Expandi as part of an outbound motion and reported at least 5 booked appointments per week. One campaign started with 907 interested contacts. Of the 719 prospects sent connection requests, 52.85% accepted. The reply rate among accepted connections was 18.92%.
UltB traced an interested audience through requests, acceptances, replies, and weekly meetings. It shows why a meetings-per-week KPI needs the funnel counts behind it.
Where to start with lead generation KPIs
- Choose one KPI from each stage. Connection acceptance, positive reply rate, cost per held meeting, and speed to signal are a good starting point.
- Write the formula and denominator beside every target. Run the same definitions for one complete campaign cycle, compare the result with a relevant segment, and fix the weakest stage first.
Expandi brings LinkedIn outreach stats, team-level Workspace Analytics, replies, and CRM activity into the same operating flow. Start a 7-day free trial to measure your first motion against the 2026 outreach benchmarks.
Frequently Asked Questions
Start with 4 to 7 across the funnel. Add a KPI only when it supports a recurring decision. A small team rarely needs all 18 each week.
A metric records activity. A KPI ties that activity to a target, owner, and decision. Messages sent may be a metric, whereas positive reply rate can be a KPI.
Choose one pipeline-sourcing rule and keep a separate influence field. Credit the channel that created the qualified opportunity, record other touches, and apply the rule to every deal.
Report funnel counts beside acceptance, reply, positive reply, meetings held, cost per meeting, and sourced pipeline. Include the audience, date range, and definitions. Put internal activity metrics in an appendix unless they explain a result.
Run it until the cohort can complete the sequence and produce a useful sample. The duration depends on step delays and sales-cycle length. Label incomplete data provisional.
Use both, with outcomes carrying more weight. Activity shows process adherence; qualified conversations, held meetings, and pipeline show if it works. Don’t hold an SDR solely accountable for closed revenue.


You’ve made it all the way down here, take the final step